
- XRP erased some of its losses but data showed that it might not be enough
- While some traders bought the dip, the shorter EMAs signalled a downtrend
After falling from $0.59 to $0.43 between 13 and 17 April, XRP’s price retested and broke past the $0.50-psychological resistance on 18 April.
In fact, at the time of writing, the altcoin was valued at $0.51, having climbed by 5% in 24 hours on the back of Bitcoin’s halving. While that is cause for optimism, on-chain data revealed that recovery could be short-lived. To assess this contention, AMBCrypto checked XRP’s supply distribution.
A token in trouble
According to data from Santiment, the number of addresses holding 100 to 1 million tokens has significantly fallen from the figures seen a few weeks ago.
For example, the number of XRP holders who own 100,000 to 1 million tokens was about 31,000 in March. However, at press time, it was no longer the case. Those holding 100 to 1,000 XRPs were close to 731,000 in the past. That figure has also fallen, dropping to 718,000 at press time.
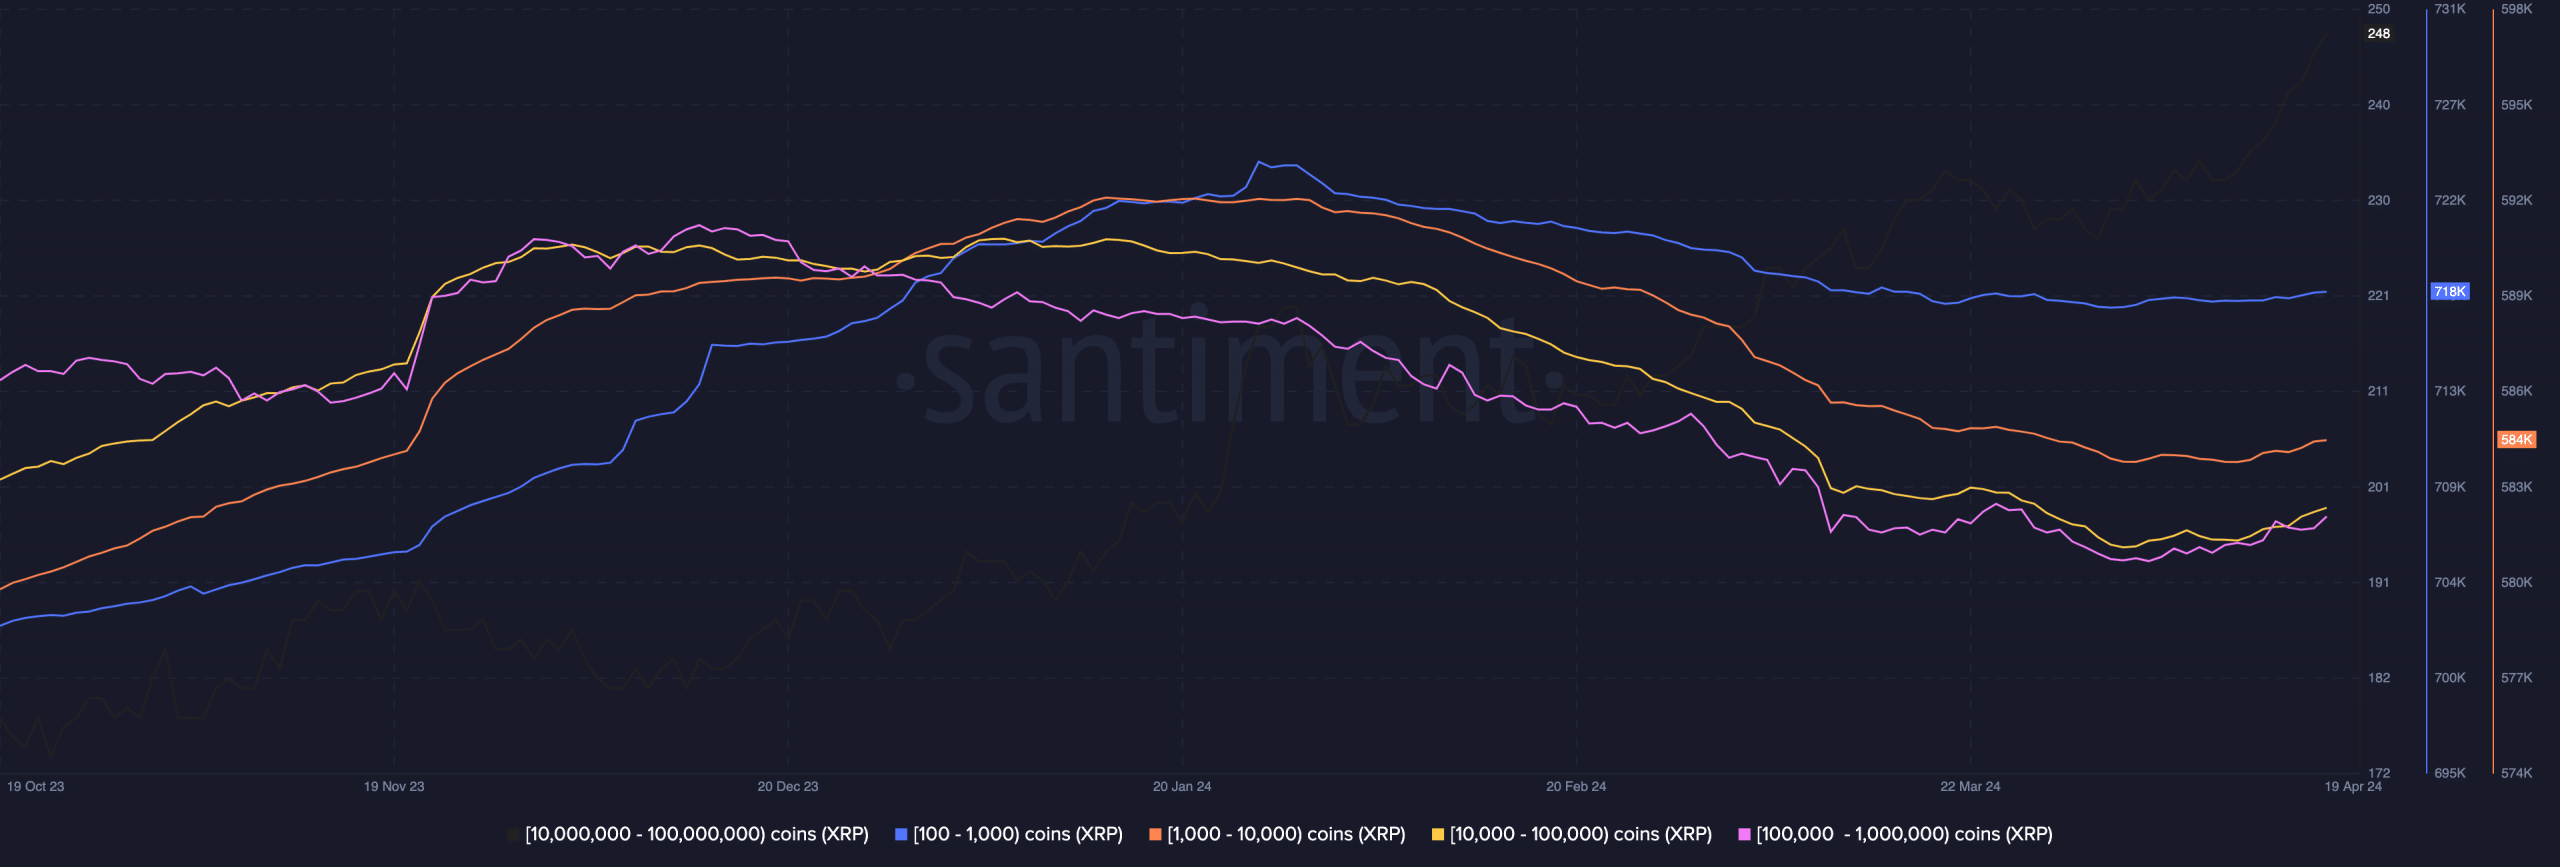
Source: Santiment
A scenario like this implies that a section of the army no longer wants to be part of the force. Owing to this decreasing confidence, XRP might find it hard to revisit previous peaks around $0.72.
Beyond this condition, another factor that could hinder the cryptocurrency’s upswing is Ripple’s case against the SEC. Updates from the ongoing lawsuit suggest that Ripple would respond to the remedies-related brief on 22 April.
While judgment might not come that day, the sentiment shown by the judge might affect XRP’s price. If the perception shown by the judge is in favor of the token, then XRP might remain above $0.50. However, if the regulator gets the upper hand, the price of the cryptocurrency might drop below the critical level.
This could be accelerated by the fact that XRP was close to being overbought on the charts.
What are the indicators saying?
This was indicated by the Stochastic Relative Strength Index (Stoch RSI). With the indicator above 80, the price might retrace as the reading generated a sell signal.
However, the Accumulation/Distribution (A/D) rolled upwards, suggesting that traders had bought the previous dip. If buying pressure increases, and distribution fails to outpace accumulation, XRP might climb on the charts.
On the other hand, a hike in selling pressure could fuel a massive decline, one which could see the token drop to $0.45. Here, it’s worth noting that the Exponential Moving Average (EMA) flashed a bearish signal too.
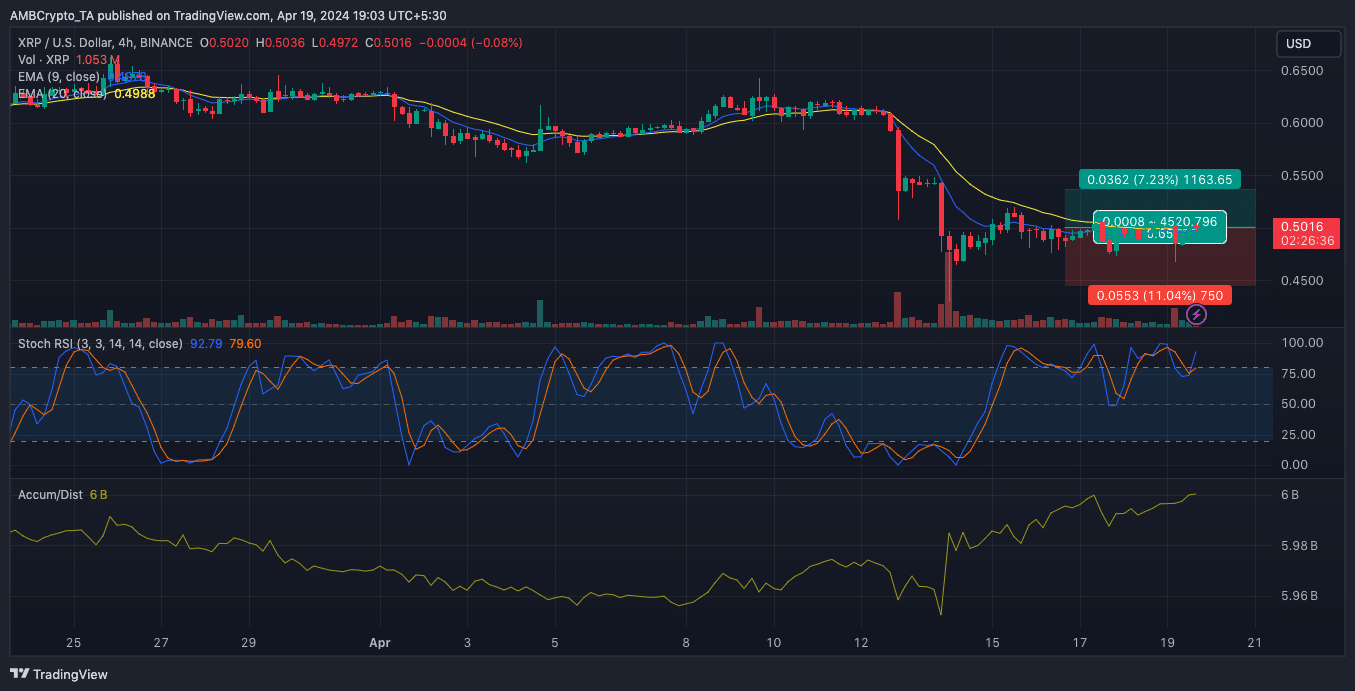
Source: TradingView
This, because the 9 EMA (blue) and 20 EMA (yellow) were around the same point. But XRP’s price dropped below both indicators, suggesting a further decline.
Additionally, the token’s realized cap was down to 147.56 million. In bull markets, an uptrend of the realized cap suggests an increase in realized profits from market participants who bought cheaper.
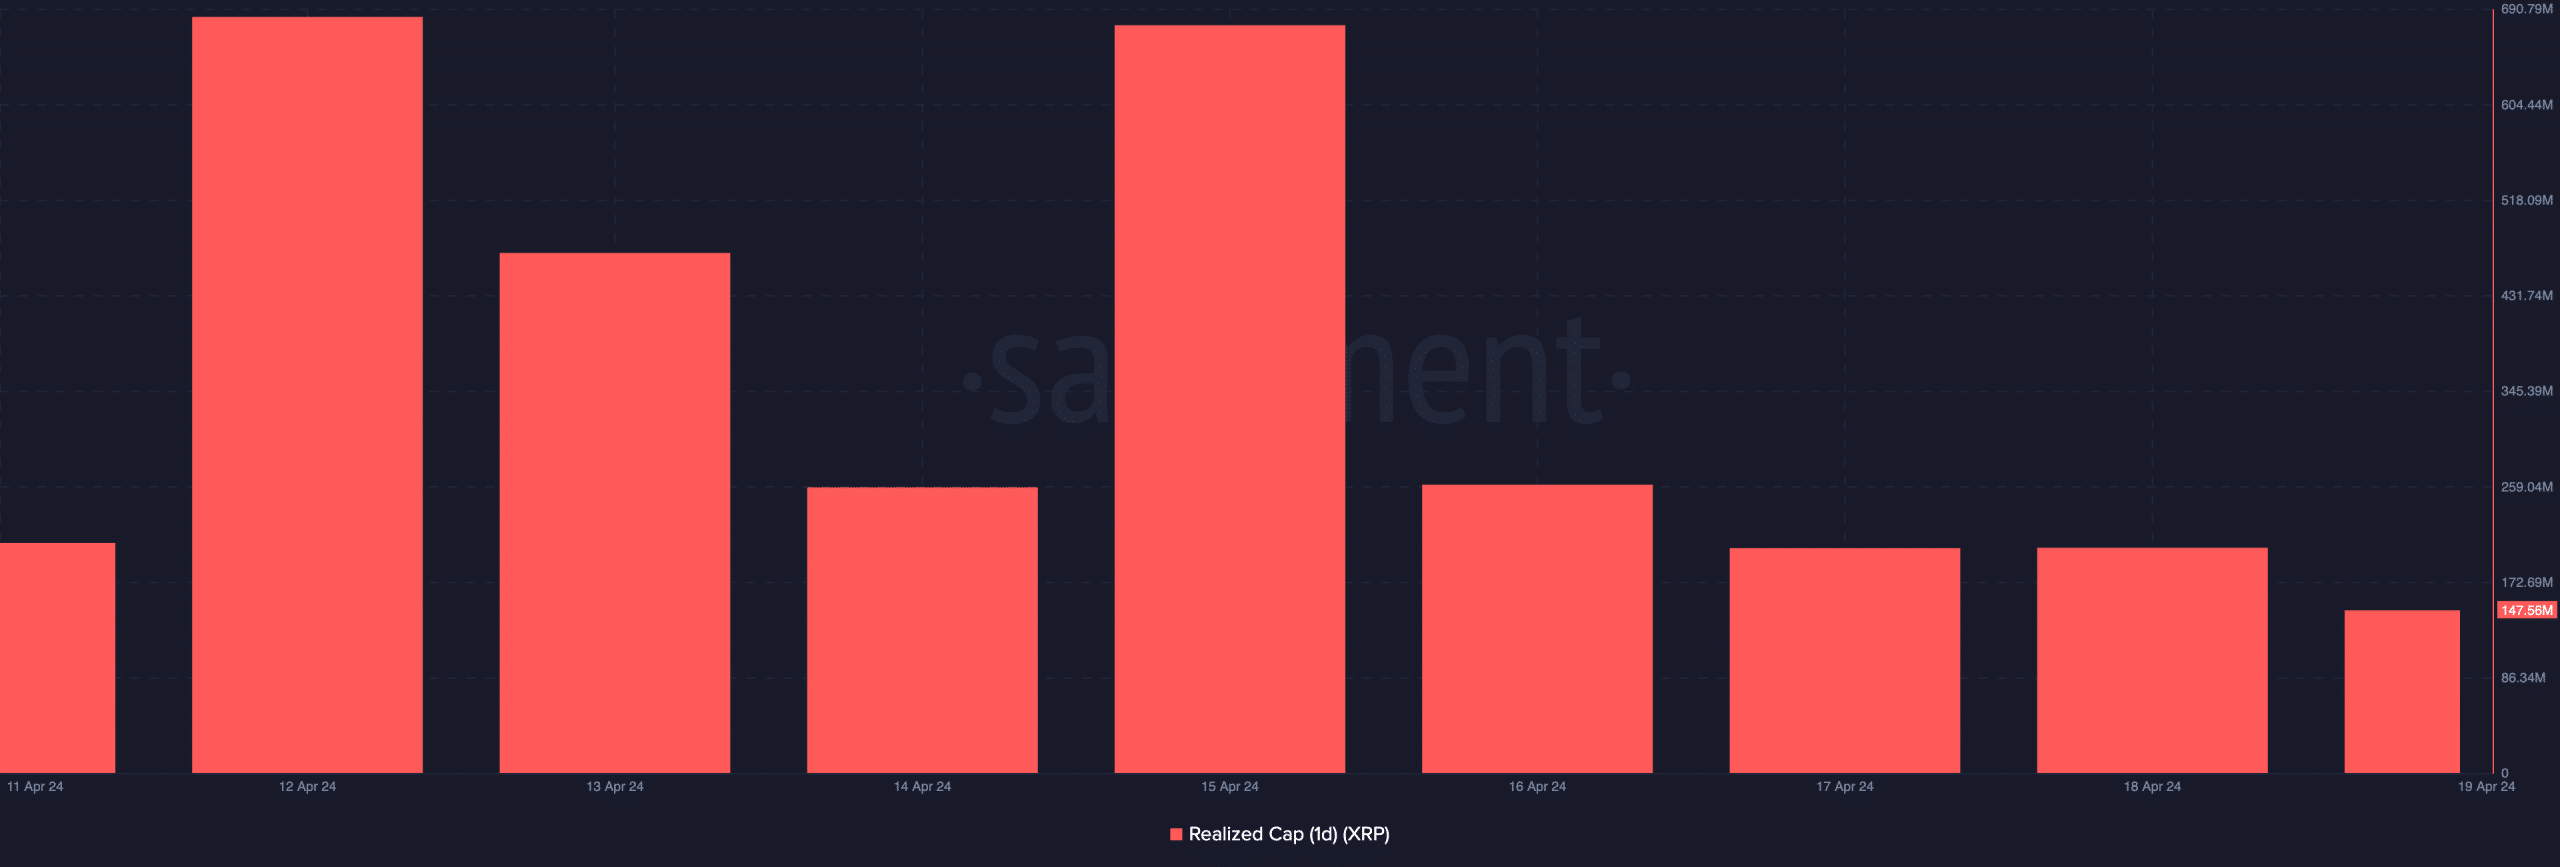
Source: Santiment
Realistic or not, here’s XRP’s market cap in BTC terms
Therefore, the decline suggests that there have been more realized losses. Hence, XRP could be characterized by another downtrend unless other participants scoop at lower prices again.