- FET ended its prolonged downtrend, and eyed a higher high of above $1.60.
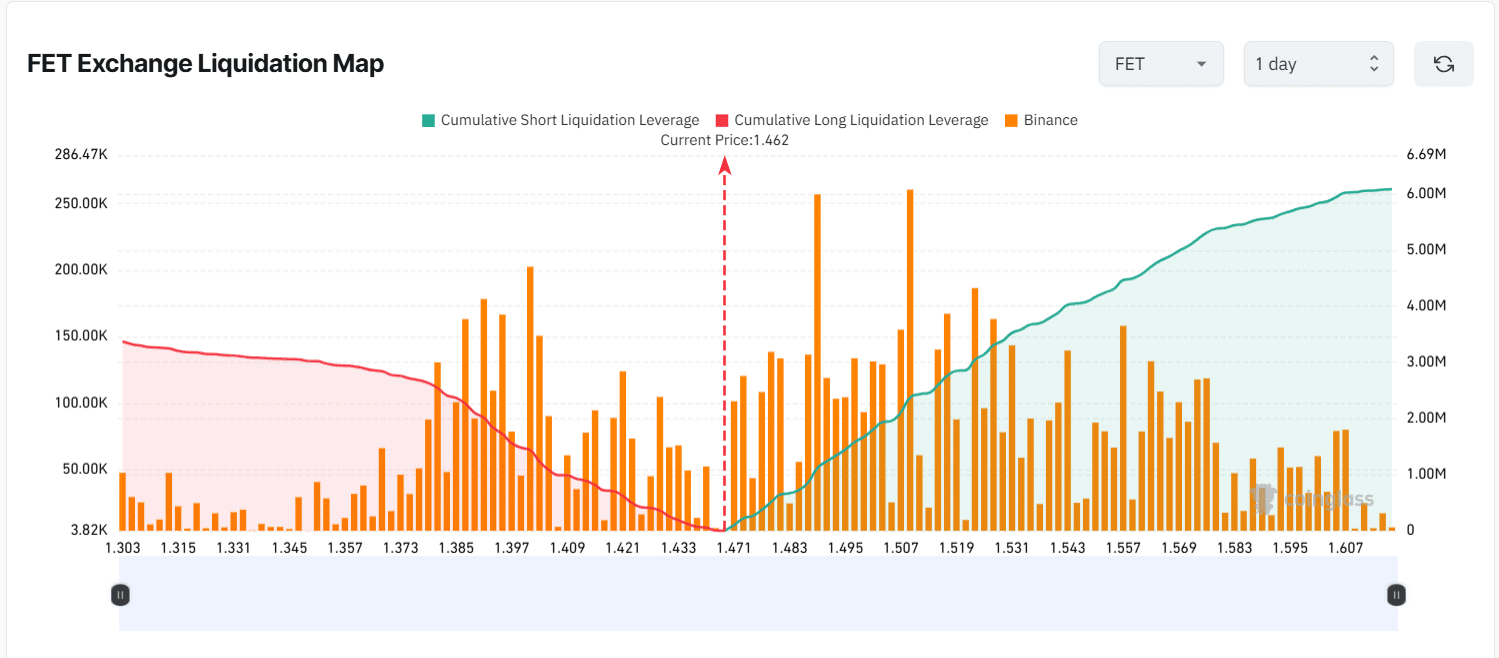
- Liquidation clusters at $1.50-$1.60 signaled leverage-driven volatility.
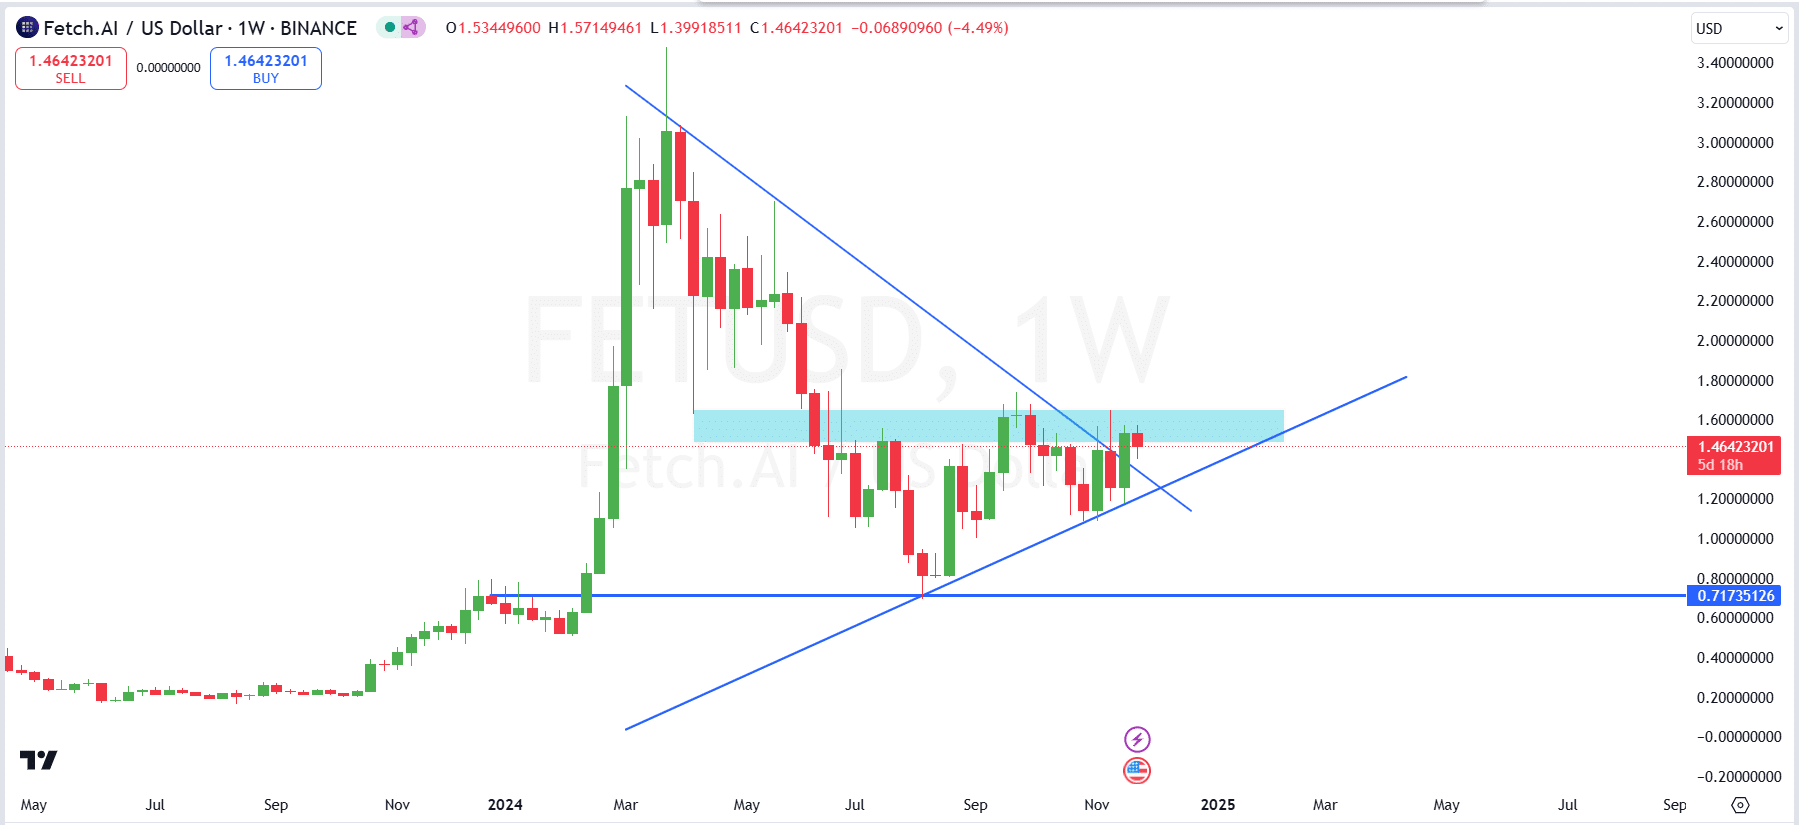
Artificial Superintelligence Alliance [FET] has recently broken a 266-day downtrend, signaling a potential trend reversal. The token’s price has increased by 7.88% over the past week, with a market cap of $3.46 billion.
However, analysts cautioned that FET faced a significant resistance at the $1.60 level.
A failure to surpass this threshold could lead to a double-bottom formation, especially if Bitcoin [BTC] experiences a correction toward $80,000.
Lower time frame analysis
After a prolonged 266-day downtrend, FET has finally broken out, moving above a descending trend line resistance with significant volume, signaling strong buyer interest.
Trading at $1.42 at press time, the breakout marks a major step forward, but the price now faces strong resistance in the $1.60-$1.65 zone.
Achieving a higher high with a close above this level is crucial to confirm a sustained uptrend and open the path toward the $2.20-$2.50 range over the next few months.

Source: TradingView
However, until FET clears this resistance, there remains the possibility of a Double Bottom formation, which could be triggered by a market pullback, potentially shaking out leveraged positions.
Failure to break $1.60 may lead to a pullback toward $1.20 or even $0.72, where strong support lies.
The next few weeks will be pivotal in determining whether FET continues its bullish momentum or consolidates at lower levels.
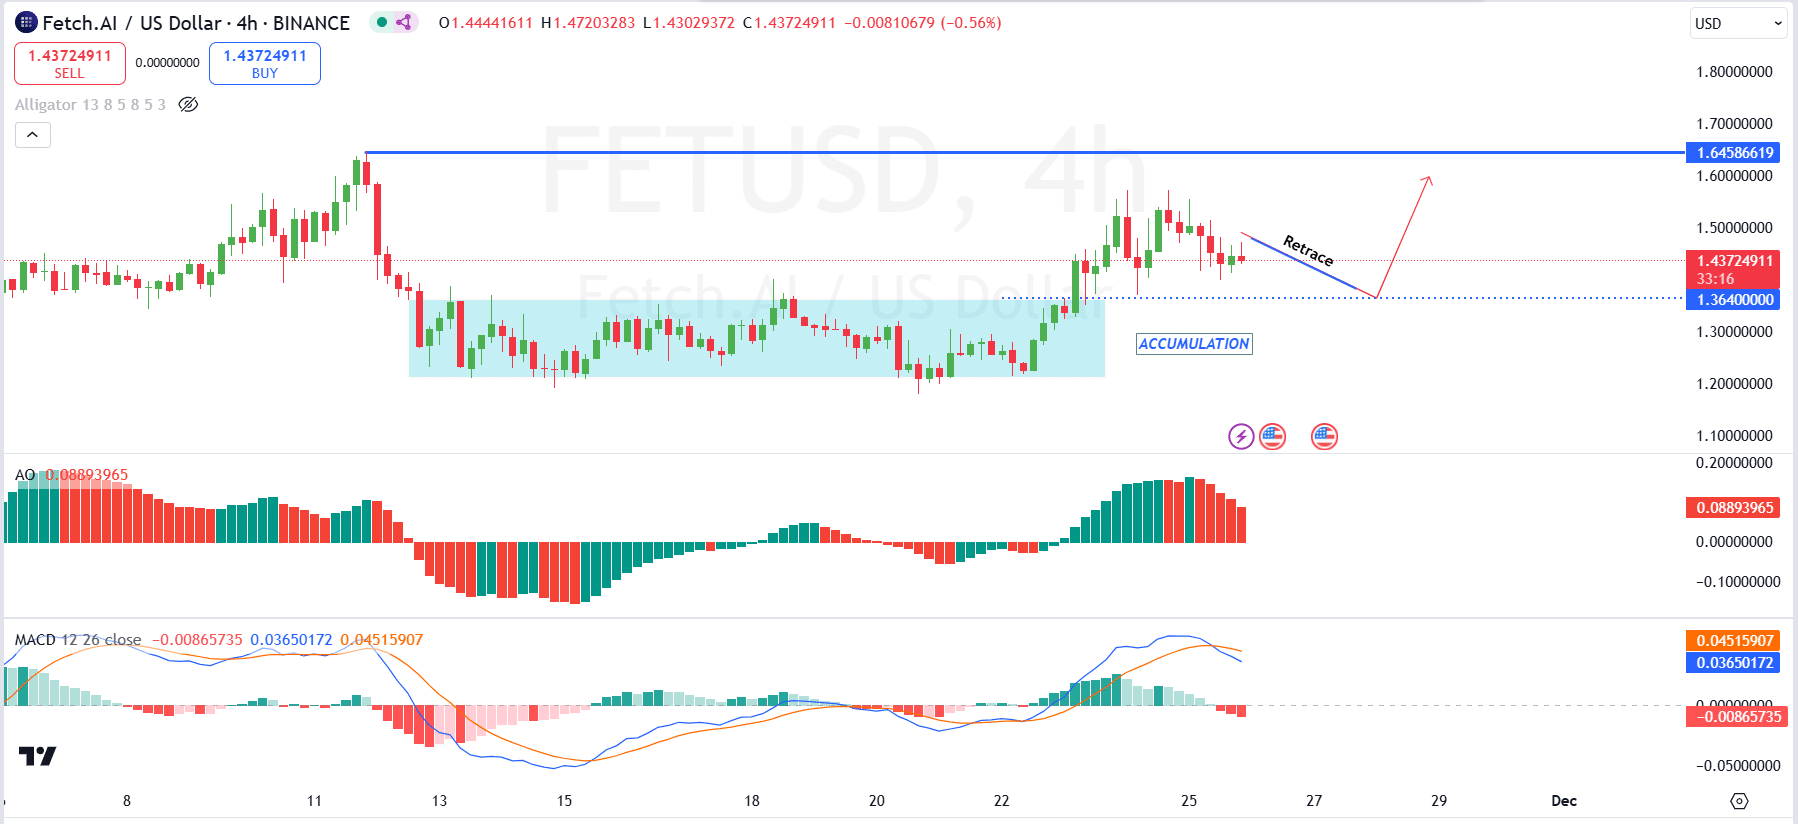
Looking at the 4- hour chart, the price is retracing to the initial accumulation range near $1.36, where buyers previously accumulated and pushed the price higher.


Source: TradingView
A retrace to this level will offer traders an opportunity to align with smart money and potentially ride the wave again to the upside.
If the price successfully bounces from $1.36 and shifts momentum, the next key level of resistance to watch is $1.645.
Indicators like the MACD, which shows weakening bullish momentum with a potential bearish crossover, and the Awesome Oscillator (AO), reflecting declining positive momentum, suggest a short-term pullback.
FET shows strong network growth
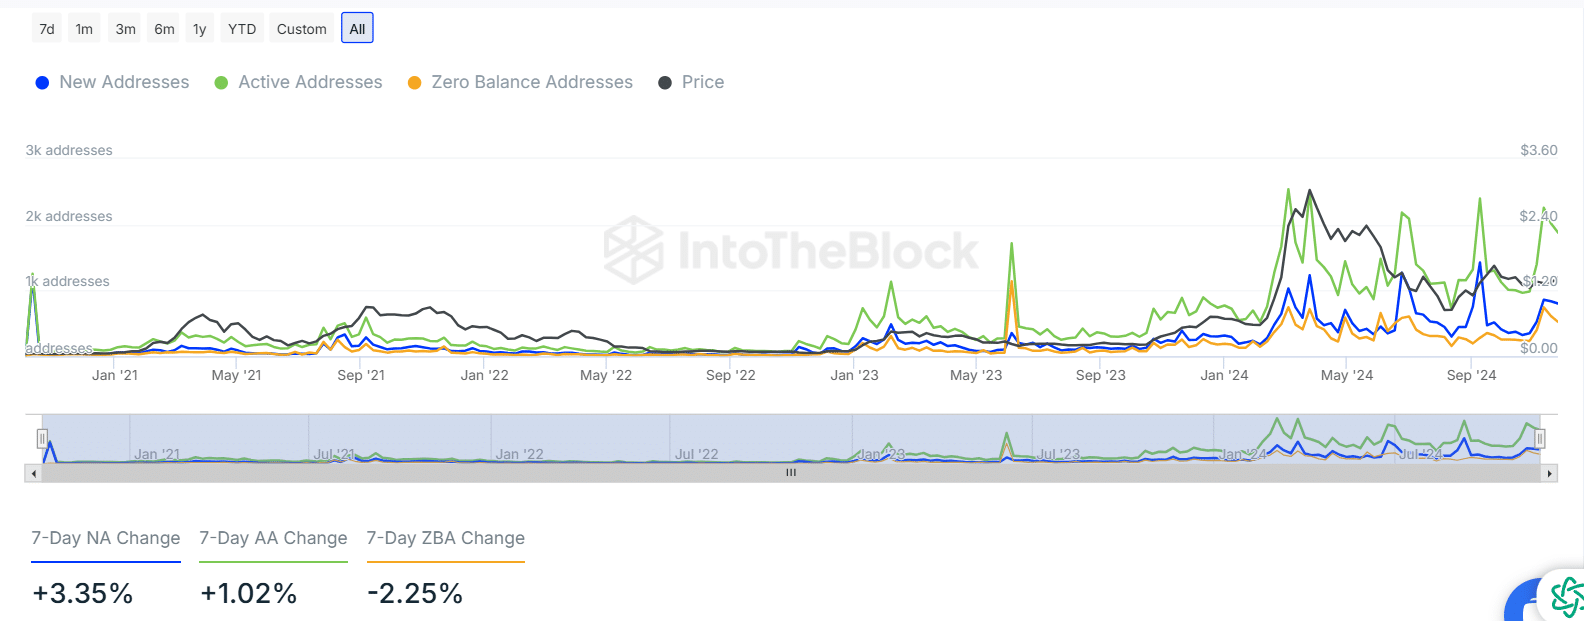
There has been a significant increase in activity for Fetch.ai, with daily active addresses (green) reaching over 2,400 during recent peaks, while new addresses (blue) climbed above 1,200, signaling growing user engagement.
Zero-balance addresses (orange) have also risen consistently, indicating an influx of new users preparing to engage with the network.
Over the past seven days, new addresses increased by 3.35%, and active addresses rose by 1.02%, further emphasizing growing adoption.
However, zero-balance addresses decreased by 2.25%, reflecting some accounts transitioning to active use.


Source: IntoTheBlock
This activity correlates closely with price movements, as the recent peak of $1.70 coincided with spikes in both new and active addresses.
The consistent rise in active addresses underscores ongoing adoption, while the decline in zero-balance addresses suggests a shift from speculative interest to actual utility and transactions.
On the upside, significant long liquidations begin to accumulate above $1.50, peaking near $1.60, indicating increased risk for over-leveraged long positions in case of a retracement.
Conversely, short liquidations are concentrated below $1.40, with the intensity increasing as the price moves closer to $1.30.


Source: Coinglass
Read Artificial Superintelligence Alliance’s [FET] Price Prediction 2024 – 2025
This suggests that a price drop below $1.40 could trigger cascading liquidations of short positions.
The map showed a high level of leveraged activity, which could lead to volatility spikes as price moves toward liquidation-heavy zones.

