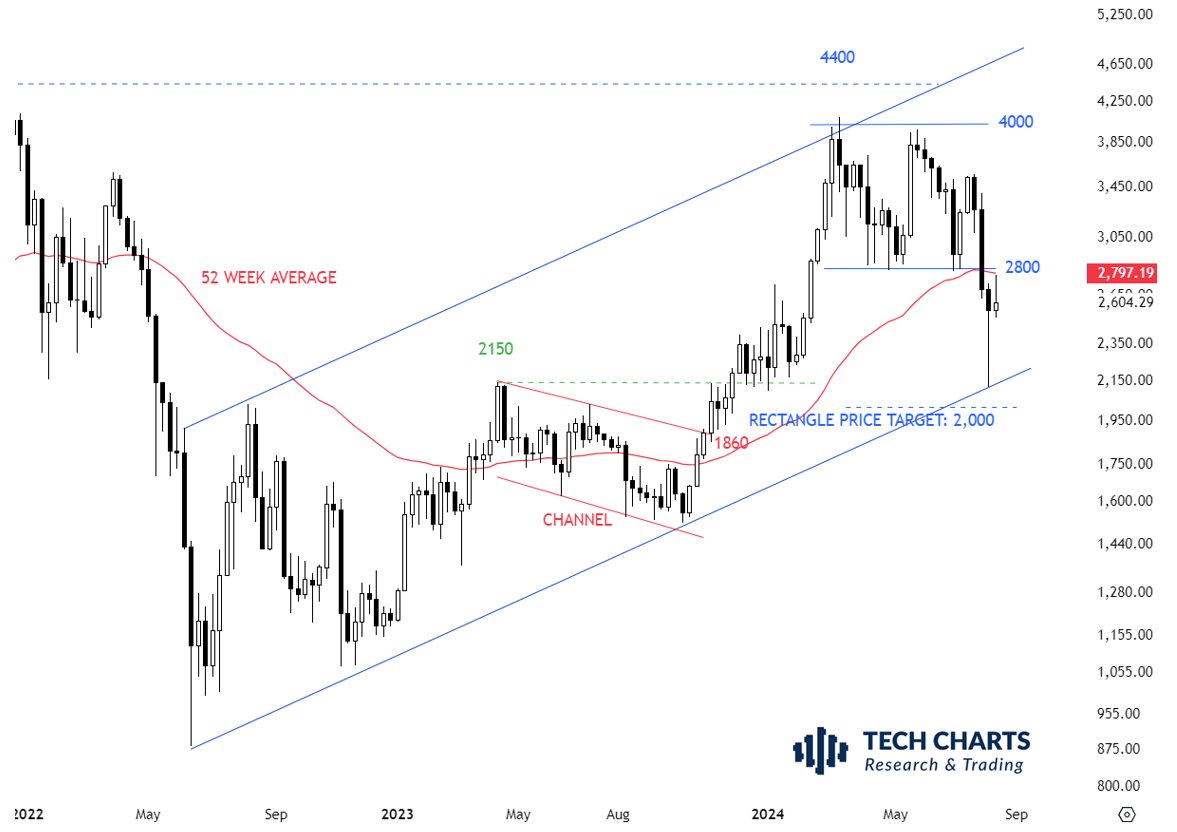
- Ethereum forms a parallel upward channel as price breaks the 52 week moving average.
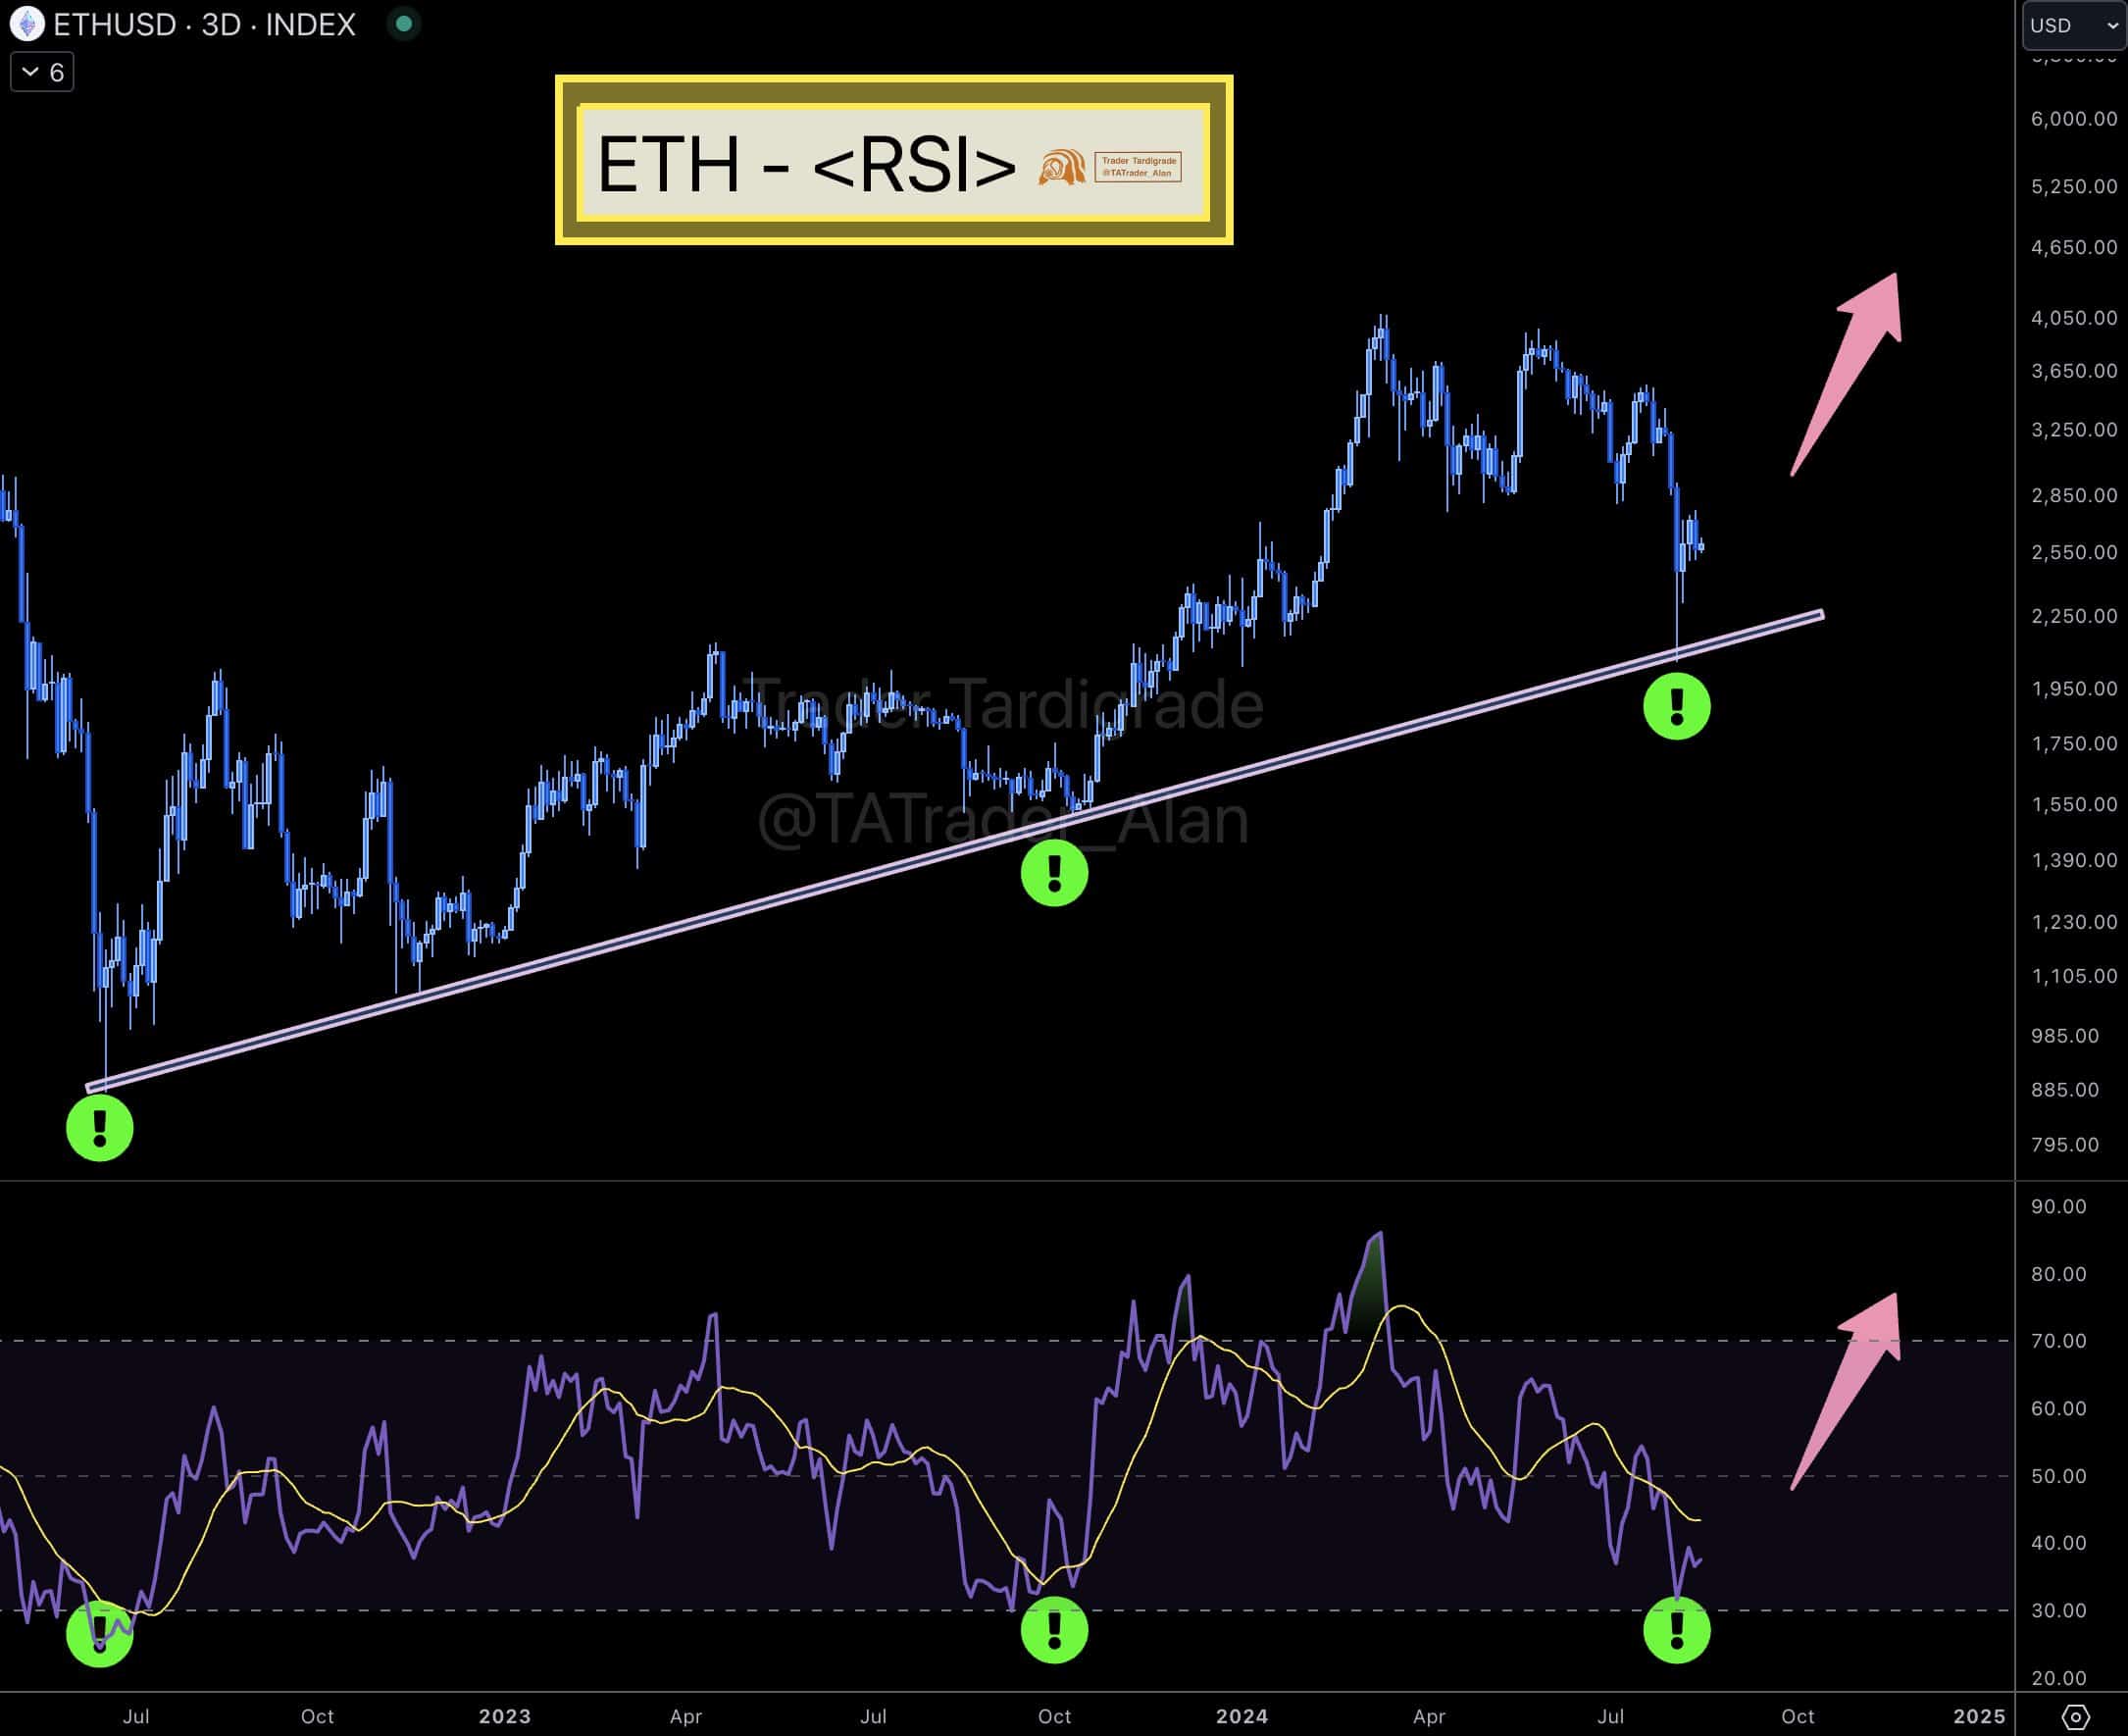
- the RSI of ETH/USD is oversold as funding rates become generally positive.
The price of Ethereum [ETH] is starting to show a clear trend as traders prepare for a potential bull market in late 2024 or early 2025.
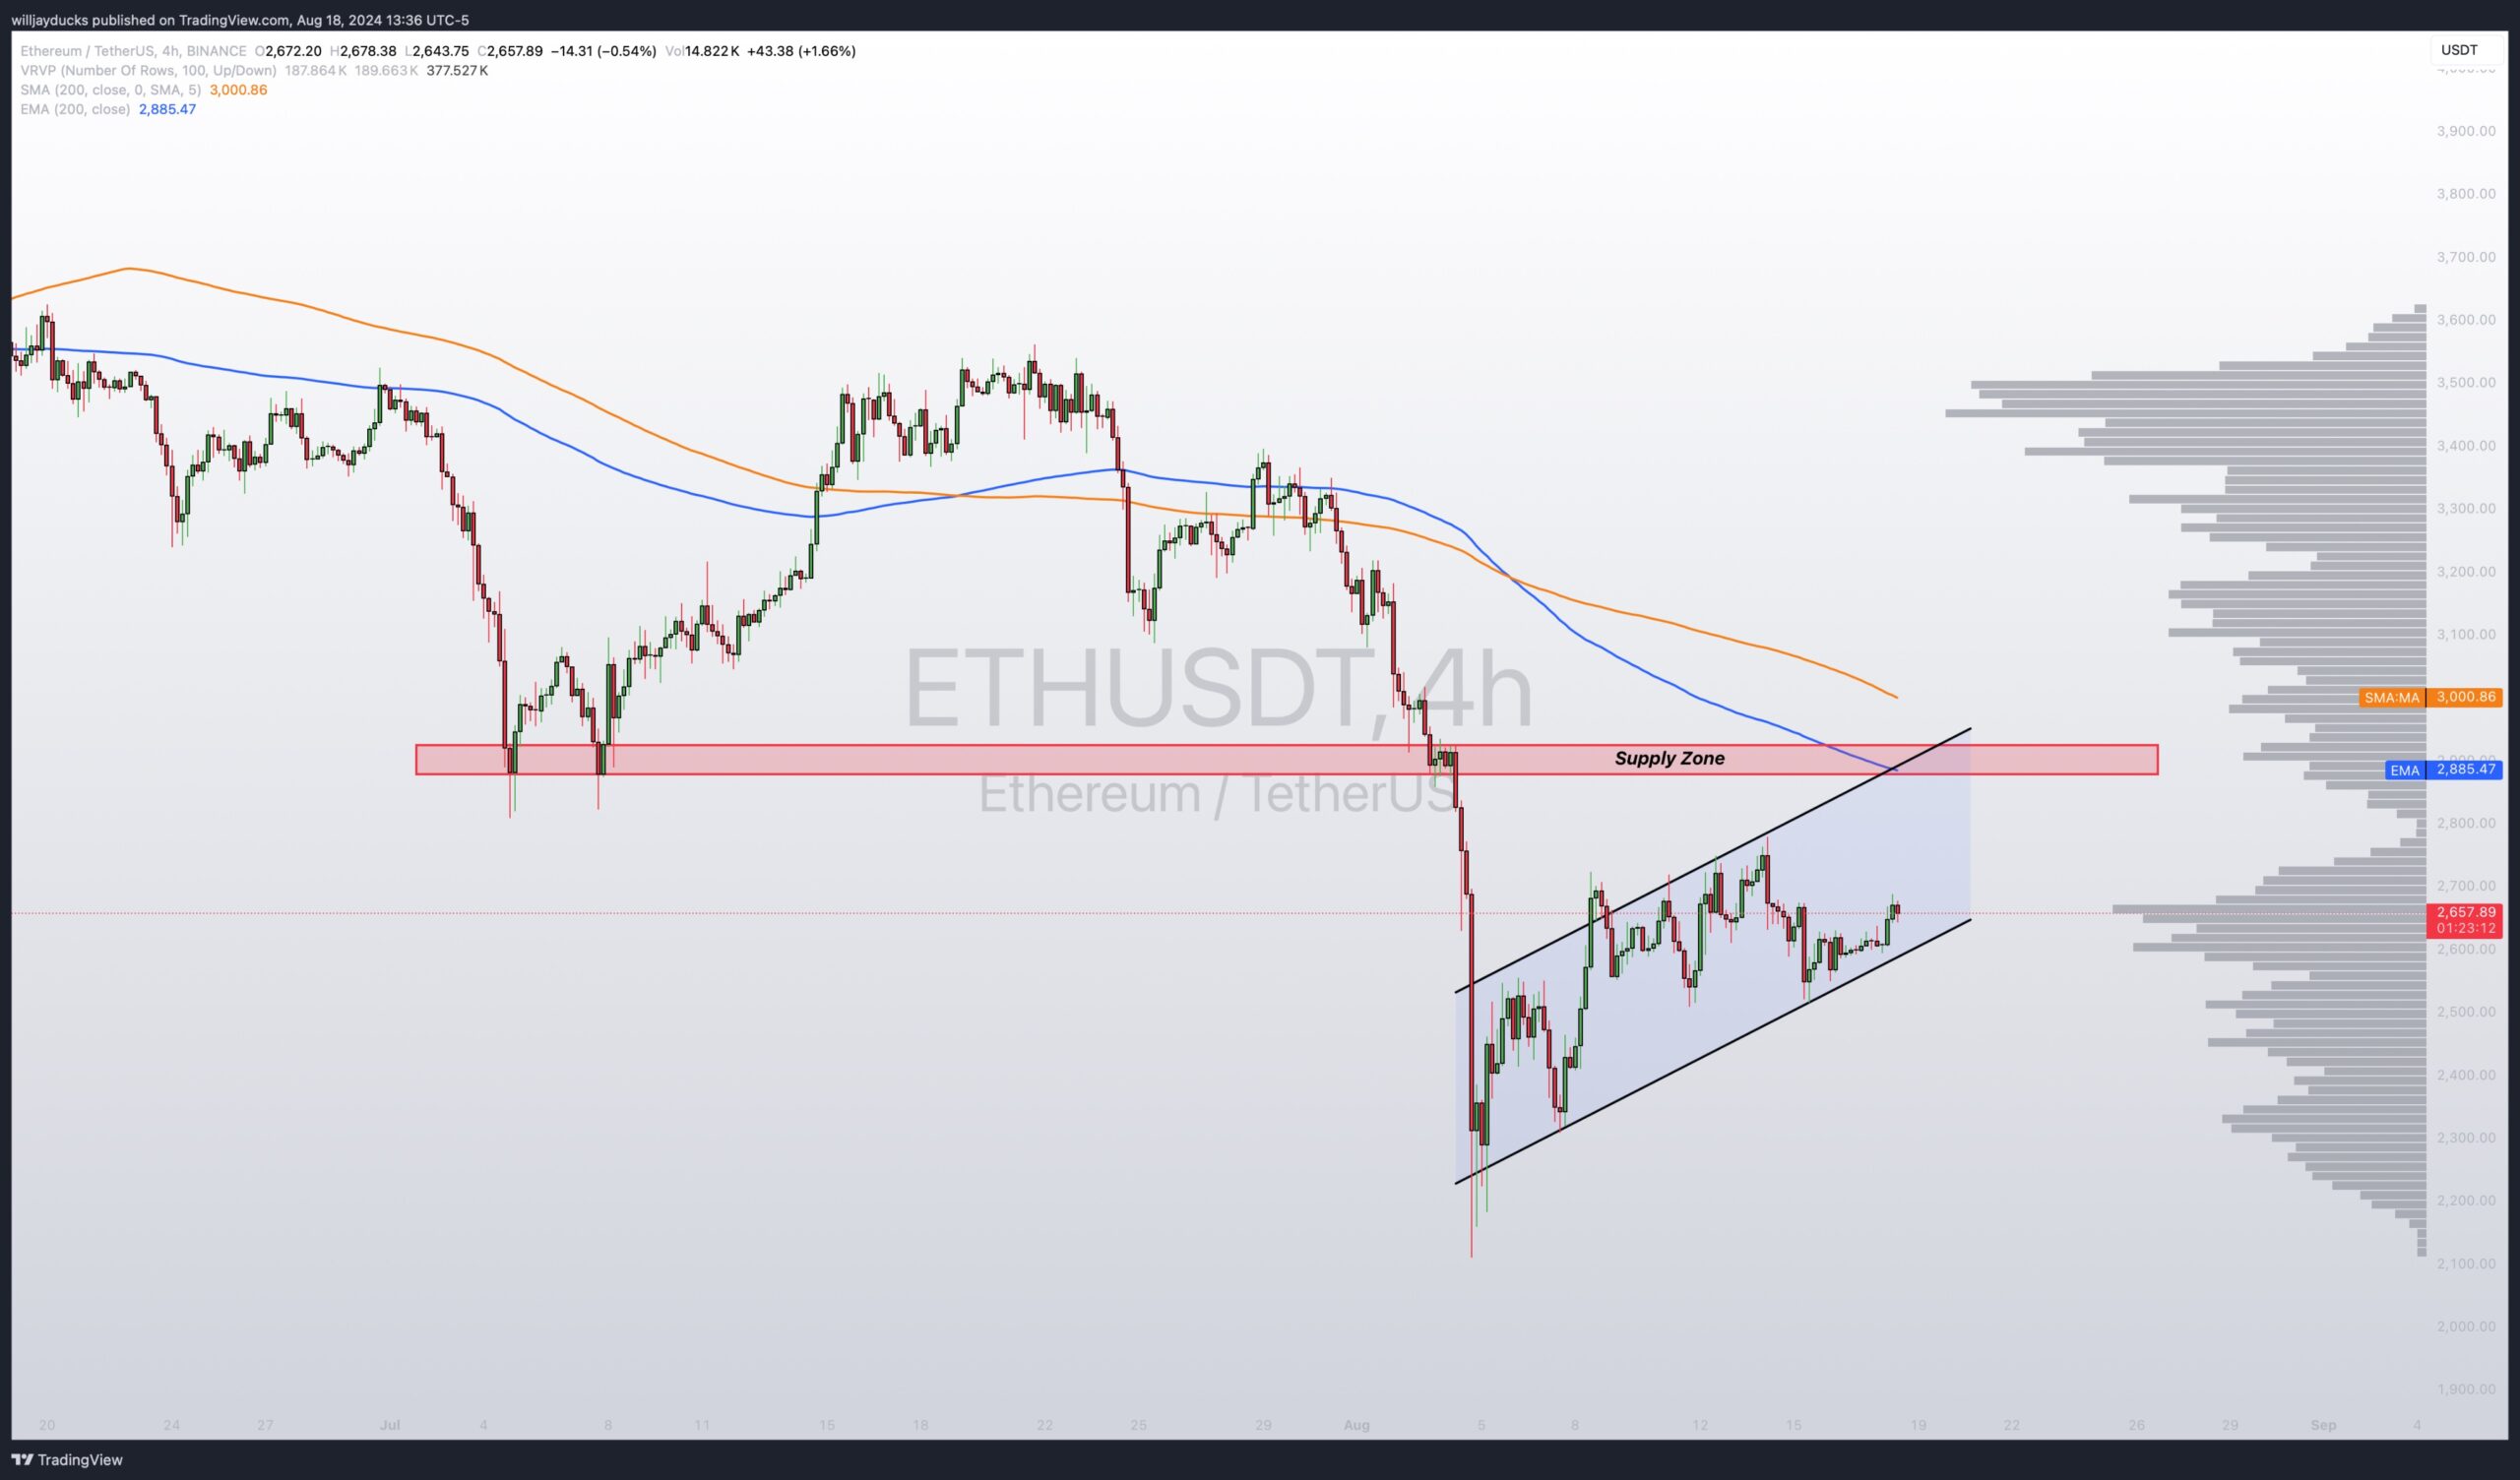
On the 4-hour chart, ETH/USDT has formed a bear flag pattern within a rising channel, heading towards the $2900 level.
It seems likely that the price of ETH will reach this supply zone, which coincides with the 200 EMA cloud on the 4-hour chart.
For a bullish trend to solidify, ETH needs to break above and stay above the 200 EMA. While the overall outlook is positive, caution is advised if the price stays below the $2900 mark for an extended period.
Source: TradingView
Additionally, ETH price on the weekly chart is following a two-year upward trend channel, repeatedly touching the lower trendline and hinting at a potential rise to the $2900 level.
Currently, the price is below the annual average, highlighting $2900 as a key resistance point.
The chart also shows that ETH/USDT has recently broken through the 52-week exponential moving average but left a long tail on the weekly candle, indicating strong buying pressure.
This suggests that despite the current price being lower, there is significant interest and potential for a move towards the $2900 mark.

Source: Tech Charts, TradingView
Altcoins at levels they bottomed
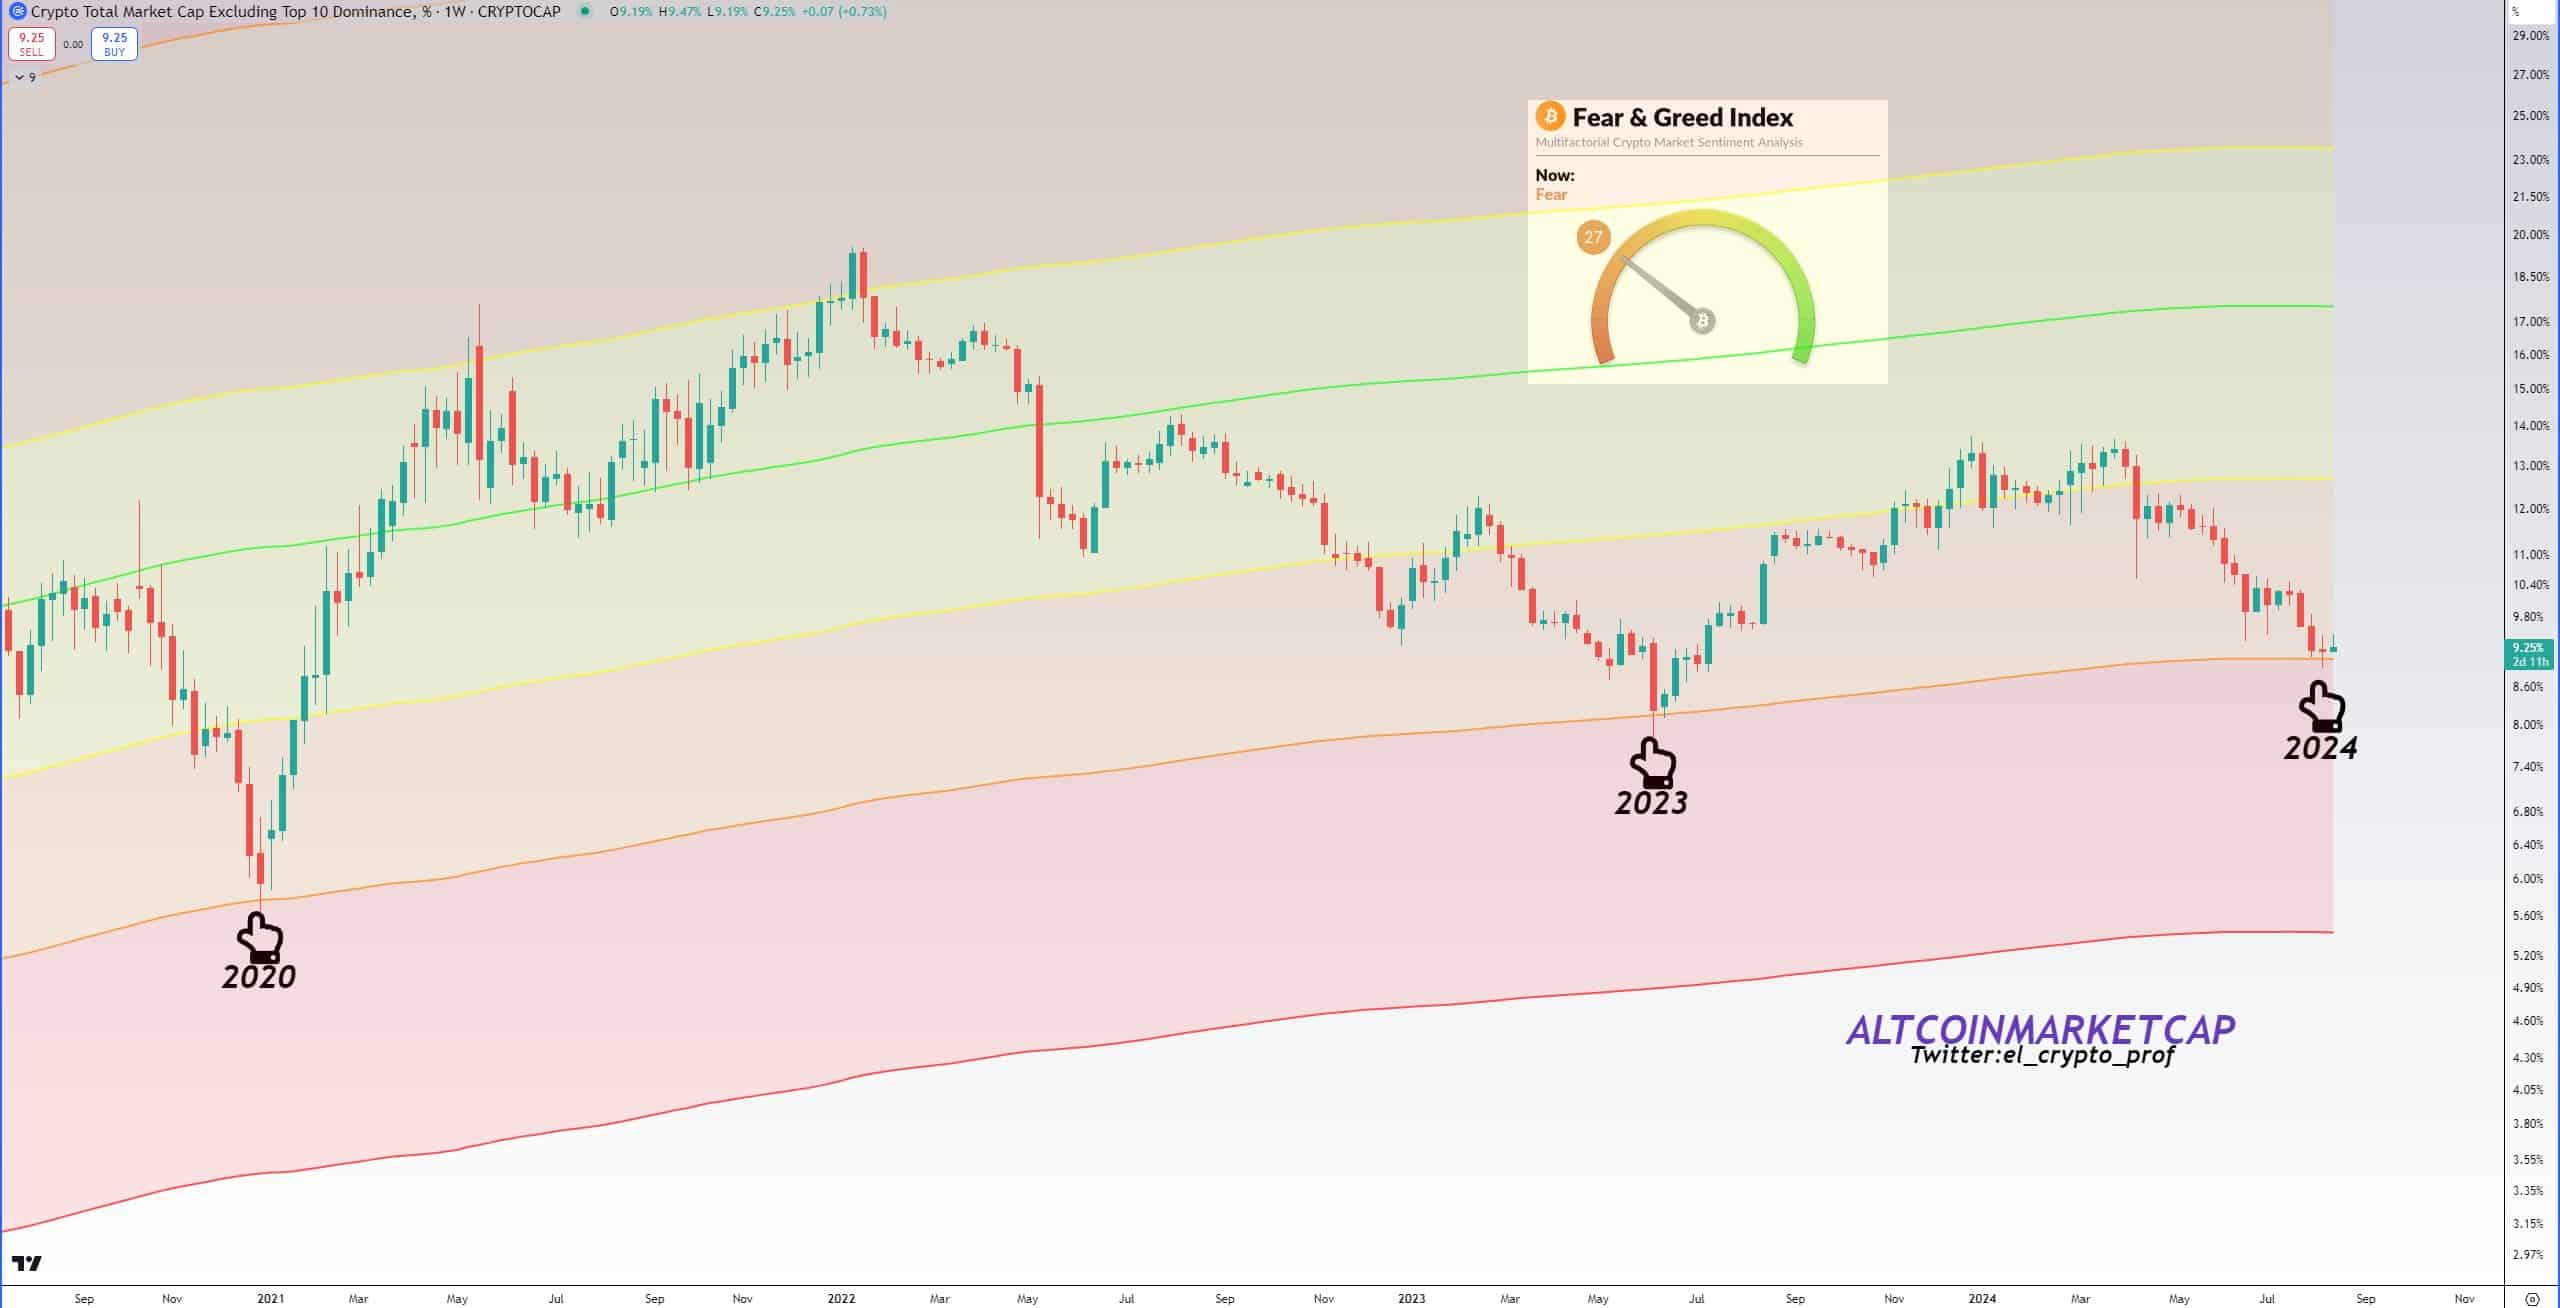
Another sign that ETH may rise is the current state of altcoins. They are now at levels similar to those seen in 2020 and 2023, which marked the lowest points for altcoins.
This suggests Ethereum might be approaching a bottom. With market participants feeling fearful and altcoins trading at these historical lows, it’s a signal of potential opportunity.
Experienced traders often advise being more aggressive when the market is fearful. As retail investors remain cautious, profitable traders see this as a chance to invest.

Source: TradingView
RSI of ETH is oversold with positive funding rates
Looking into the ETH/USDT price action, RSI has dropped to the oversold zone and bounced sharply from the 30% level.
This movement aligns with the ascending support trendline for ETH/USD, suggesting that the price is set to rebound from this point. This bounce could drive Ethereum’s price to new highs.

Source: TradingView
Finally, negative funding rates usually mean that traders betting against Ethereum (short positions) are paying those betting on it (long positions), indicating bearish sentiment.
However, Glassnode data shows that in 2024, Ethereum’s funding rates have mostly been positive, reflecting bullish expectations.
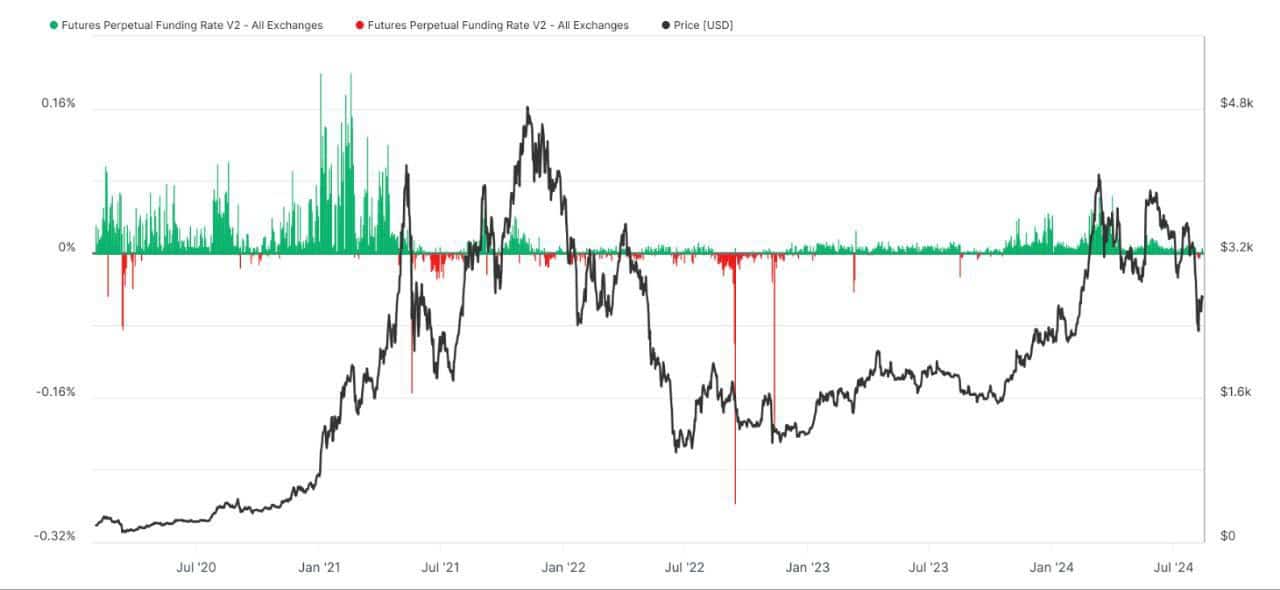

Source: Coinglass
Read Ethereum’s [ETH] Price Prediction 2024-2025
The recent drop in Ethereum’s price to $2,100, combined with falling funding rates, suggests a shift in market sentiment.
Despite this recent decline, the overall positive funding rates throughout 2024 hint at a potential price rally in the near future.

