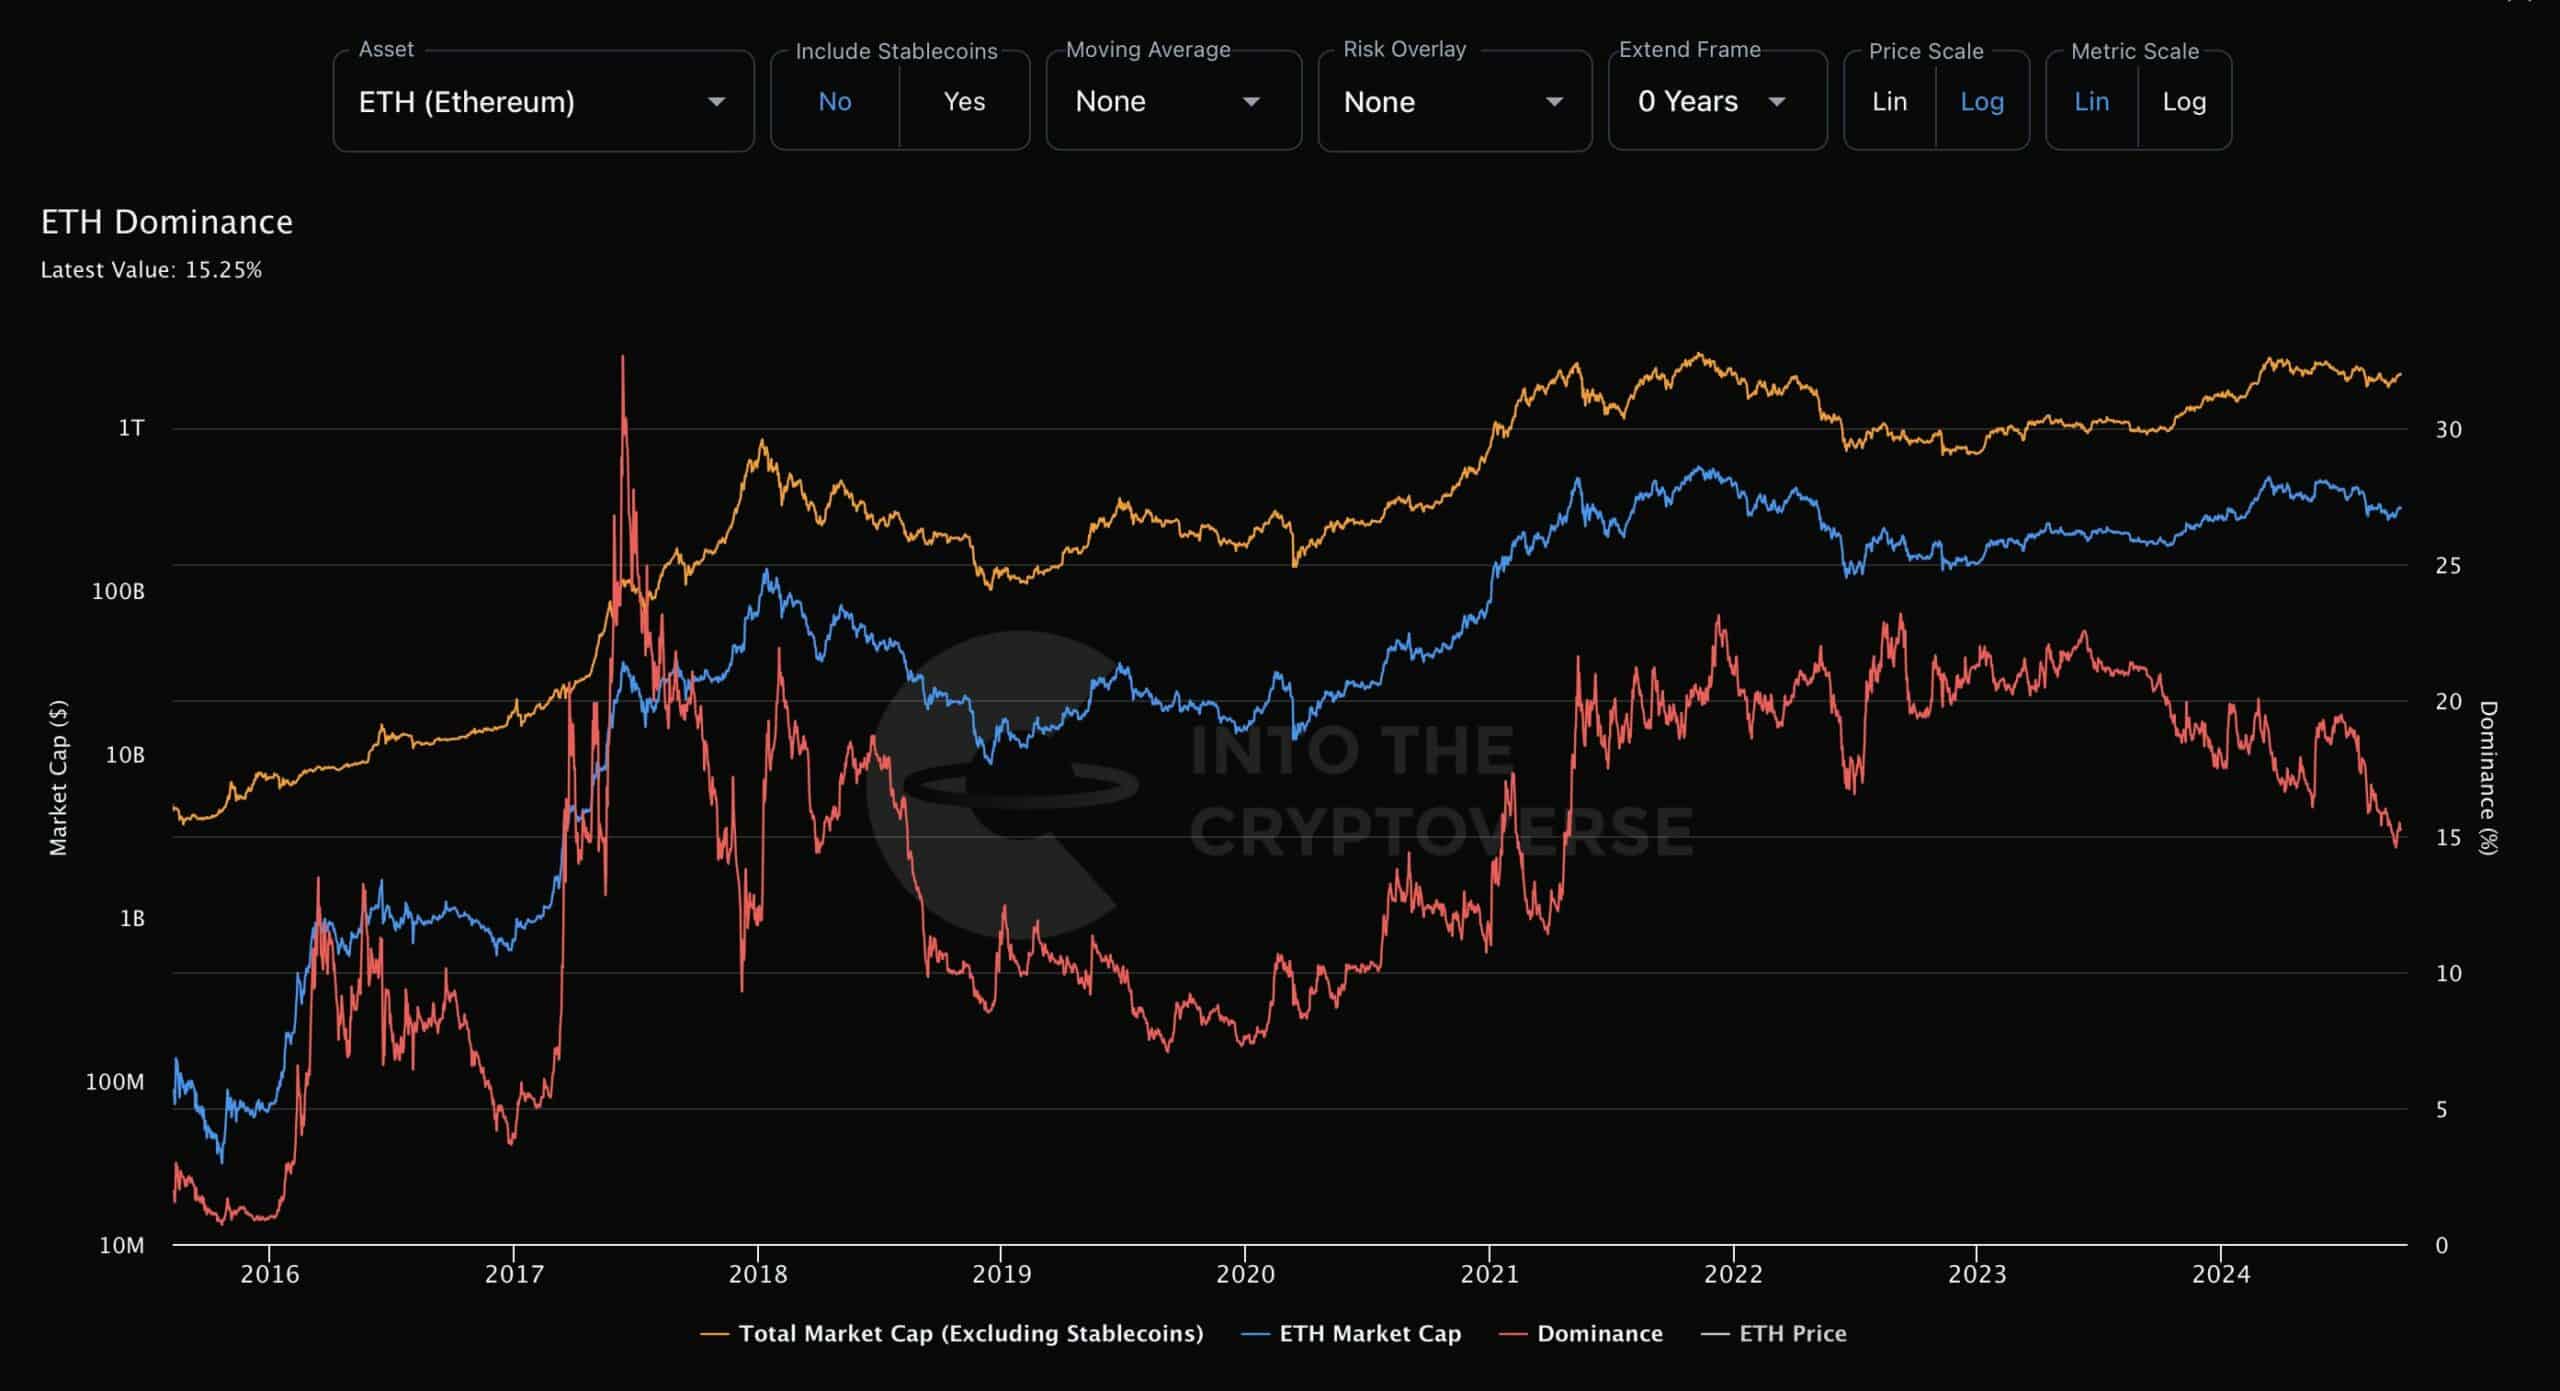
- Ethereum dominance is declining despite overall market cap being on the rise.
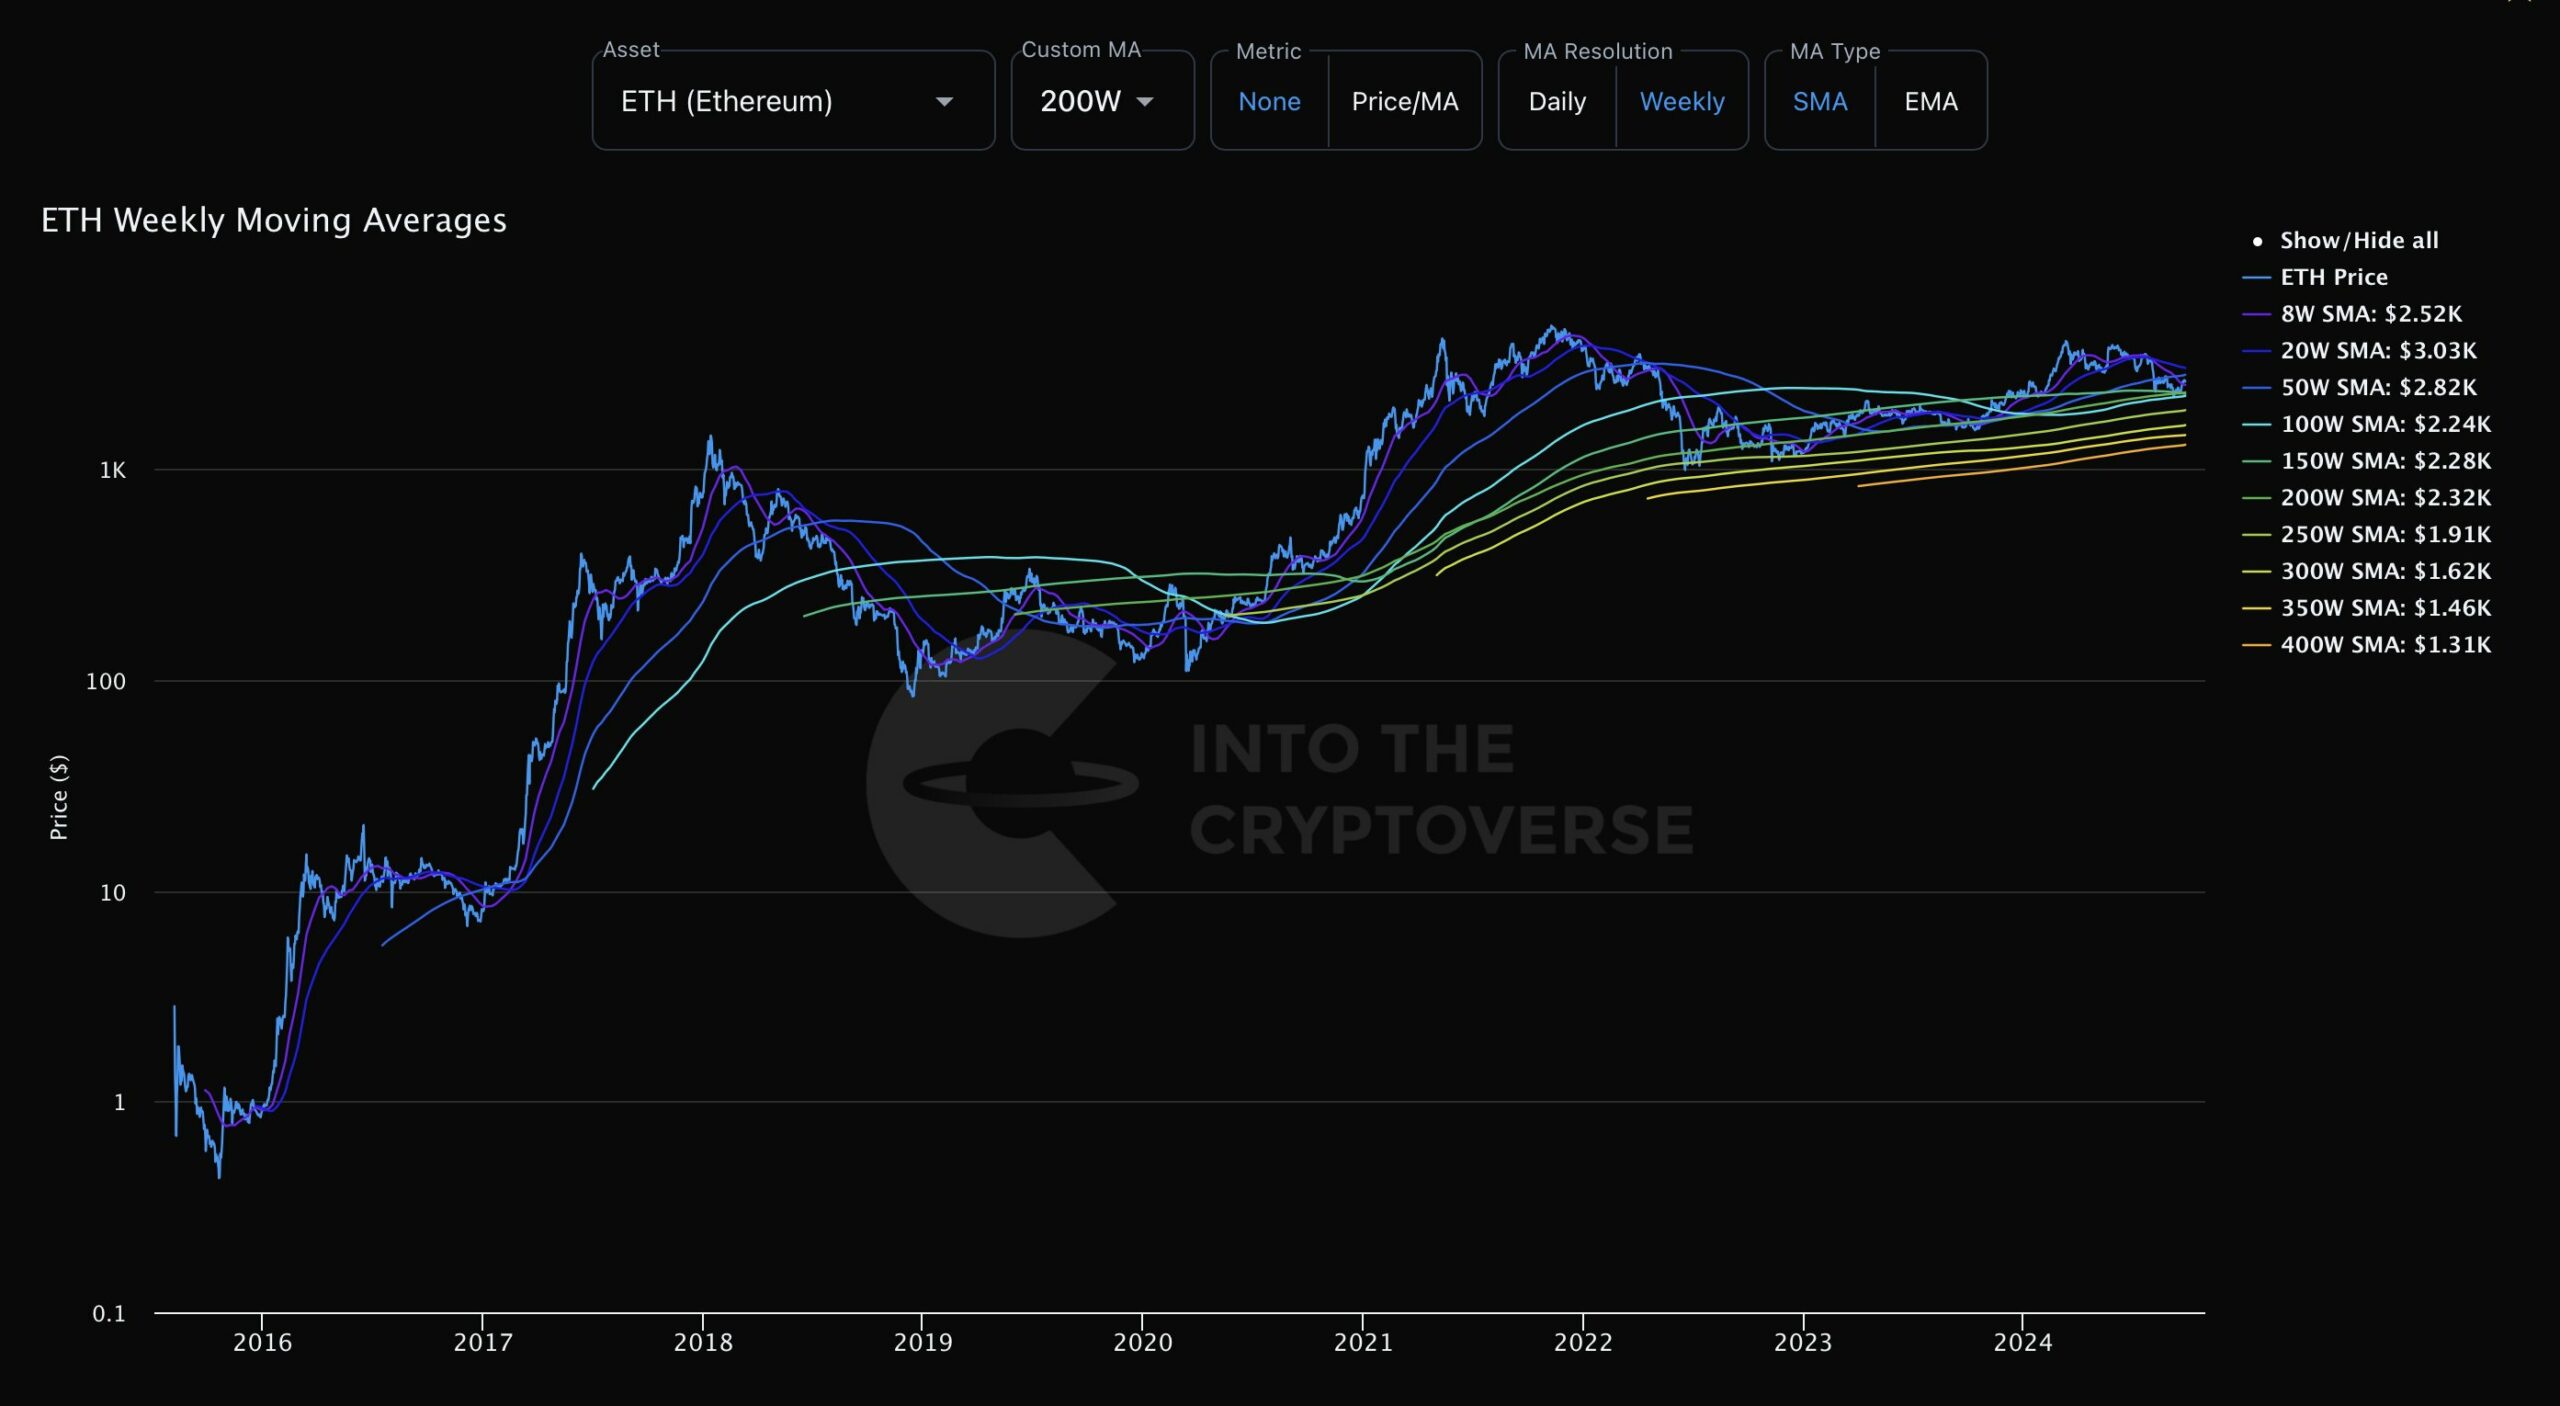
- ETH staying above all weekly moving averages signals strength.
Ethereum [ETH], the second-largest cryptocurrency by market cap, is facing challenges in maintaining its dominance in the broader crypto market.
While the total market cap of cryptocurrencies, excluding stablecoins, shows a long-term upward trend, ETH’s share in this market is declining.
Currently, Ethereum’s market dominance sits slightly above 15%, signaling that ETH might be at a crucial point. With ETH’s market cap fluctuating from $546 billion to $316 billion currently, its struggle to regain dominance raises questions.

Source: IntoTheCryptoverse
A rise in the total market cap while ETH’s share declines could indicate a divergence, often signaling a reversal or continuation of a trend. The uncertainty about whether ETH will move higher or lower remains a critical issue but what are other metrics saying!
ETH staying above weekly SMAs
Ethereum is holding strong on its weekly simple moving averages (SMAs), providing a bullish outlook. ETH remains above key SMAs, including the 8SMA and 20SMA, suggesting strong momentum.
This is an encouraging sign that Ethereum may continue its recovery, as it has bounced back from a deep decline when its price reached $2,100.
ETH’s ability to stay above these SMAs indicates that both the short-term and long-term upward trends on the weekly remain intact. However, traders should remain cautious, as the upcoming Q4 is expected to bring volatility.


Source: IntoTheCryptoverse
Despite a dip in ETH’s market dominance, these indicators support the notion that Ethereum is still on a bullish path.
Smart whales profiting
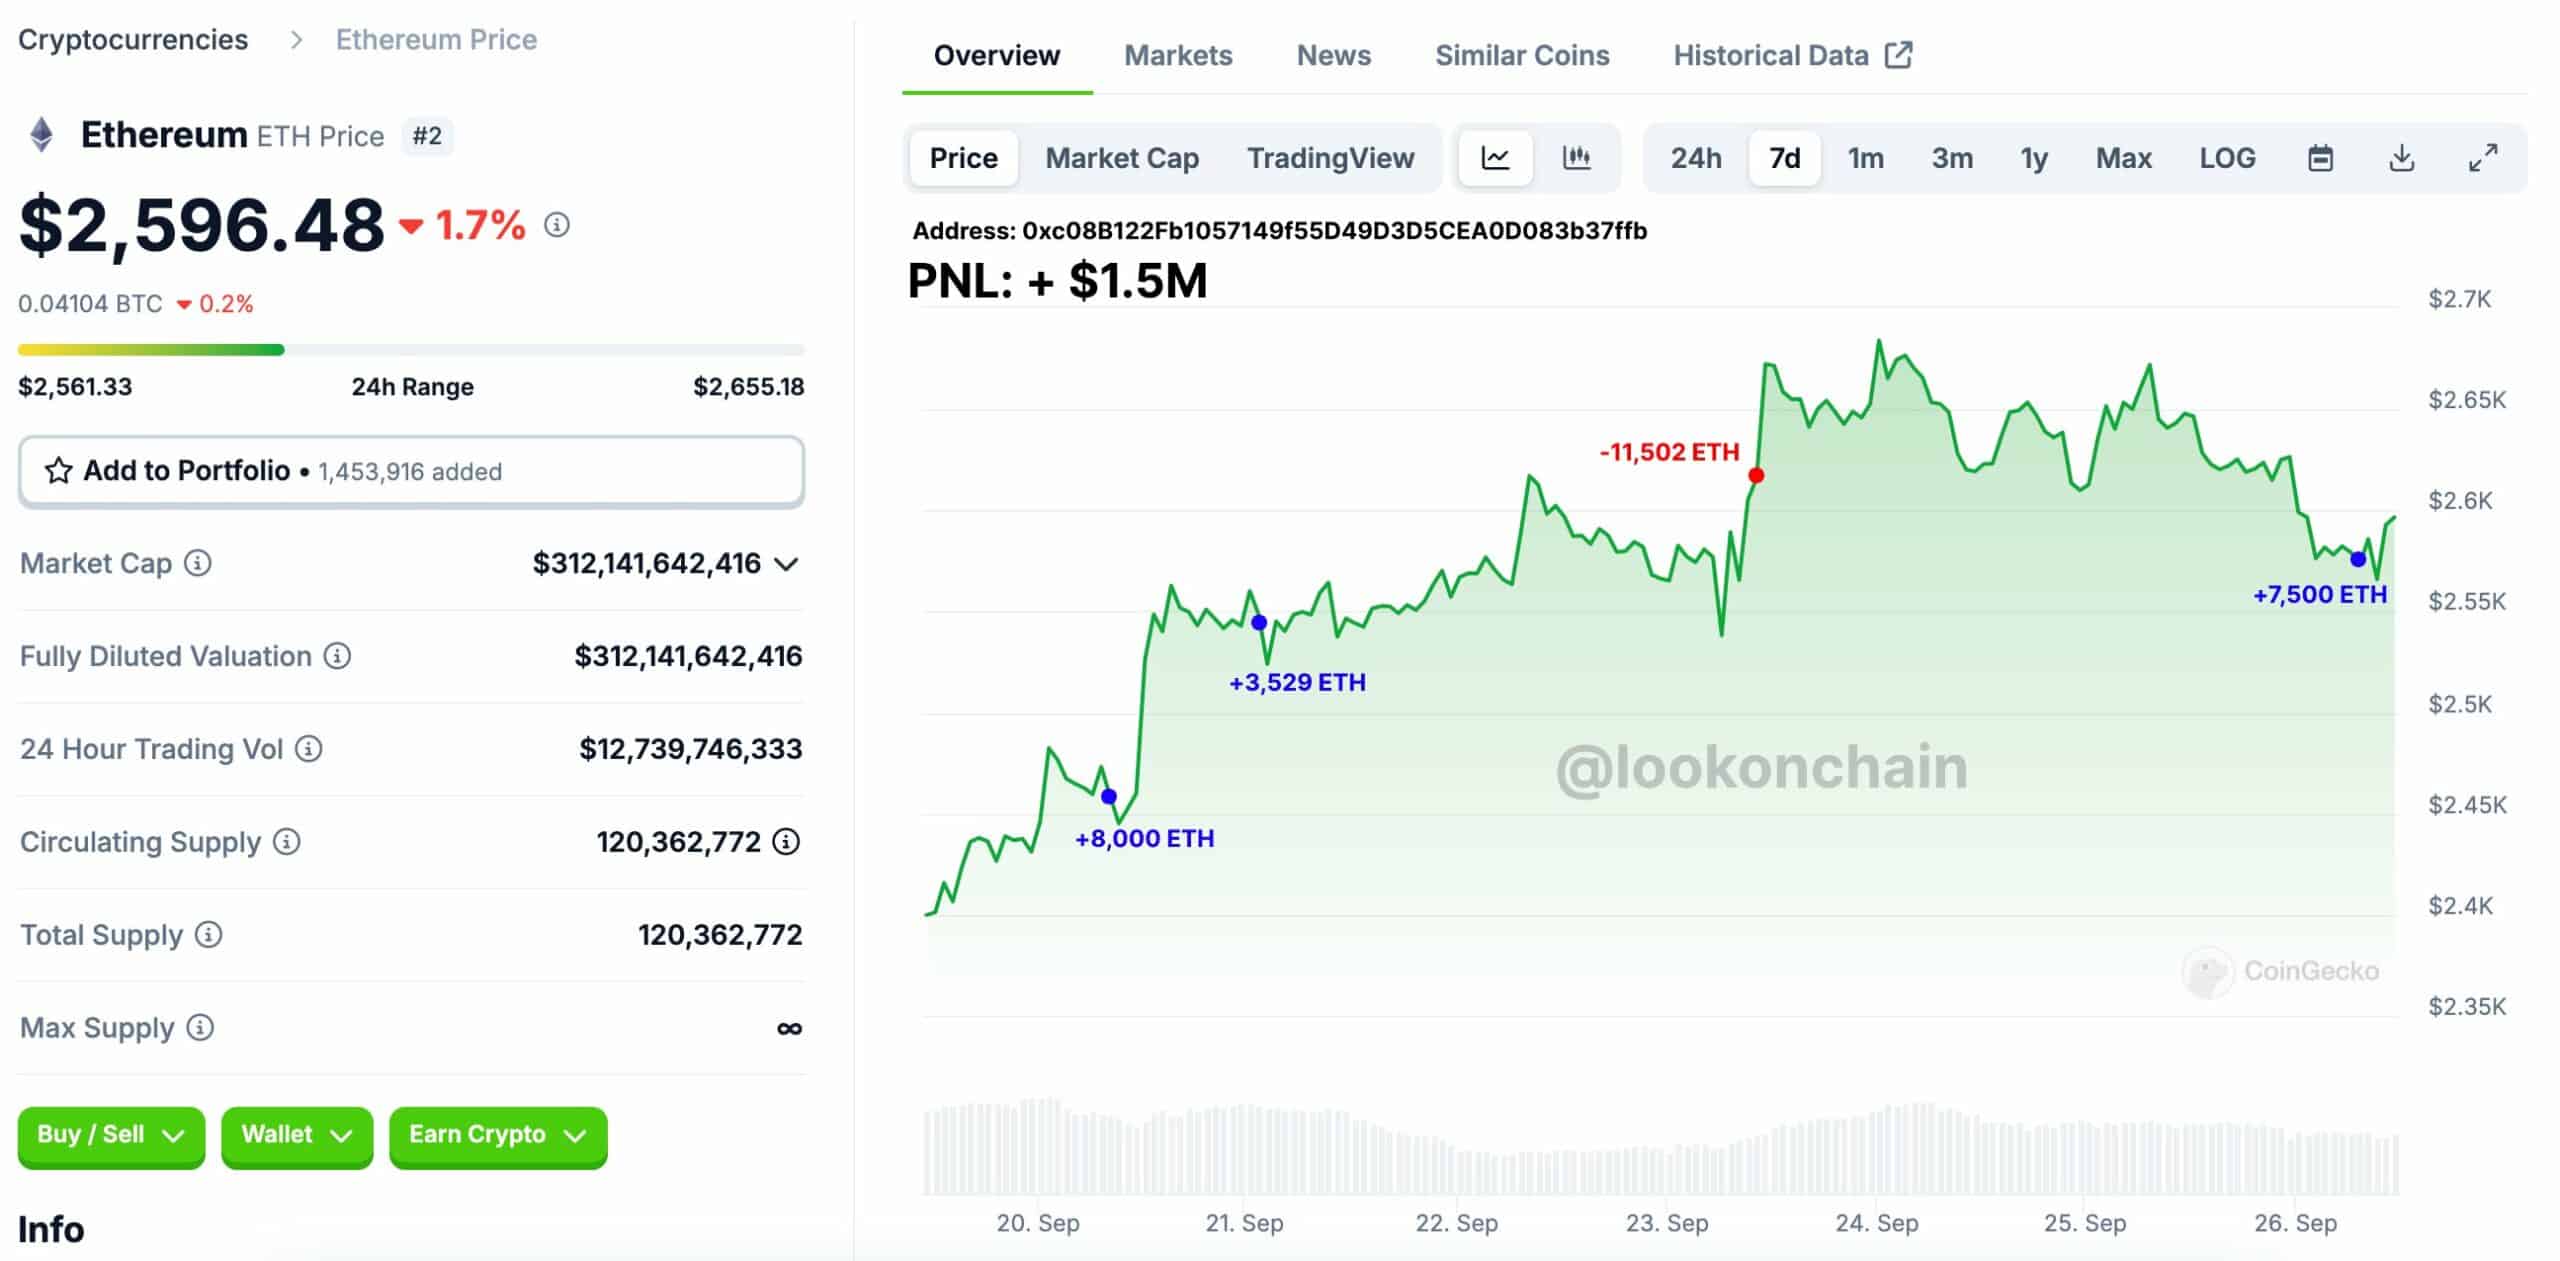
Smart whales are capitalizing on these fluctuations, offering further support for a bullish outlook. Some savvy traders have made significant profits by buying Ethereum during dips.
One whale, 0xe0b5, has consistently swing-traded ETH, with a 100% success rate across eight trades since August 12. This whale bought over 10,000 ETH worth more than $26 million and sold at higher prices, earning over $1.56 million in profit.


Source: Lookonchain
Another whale, 0xc08B, bought 11,529 ETH worth over $28 million at $2,485 and sold at $2,618 just three days later, making a $1.5 million profit.
These activities demonstrate that large traders believe in Ethereum’s potential for higher gains despite its recent dominance struggles.
Daily ETH burnt increases
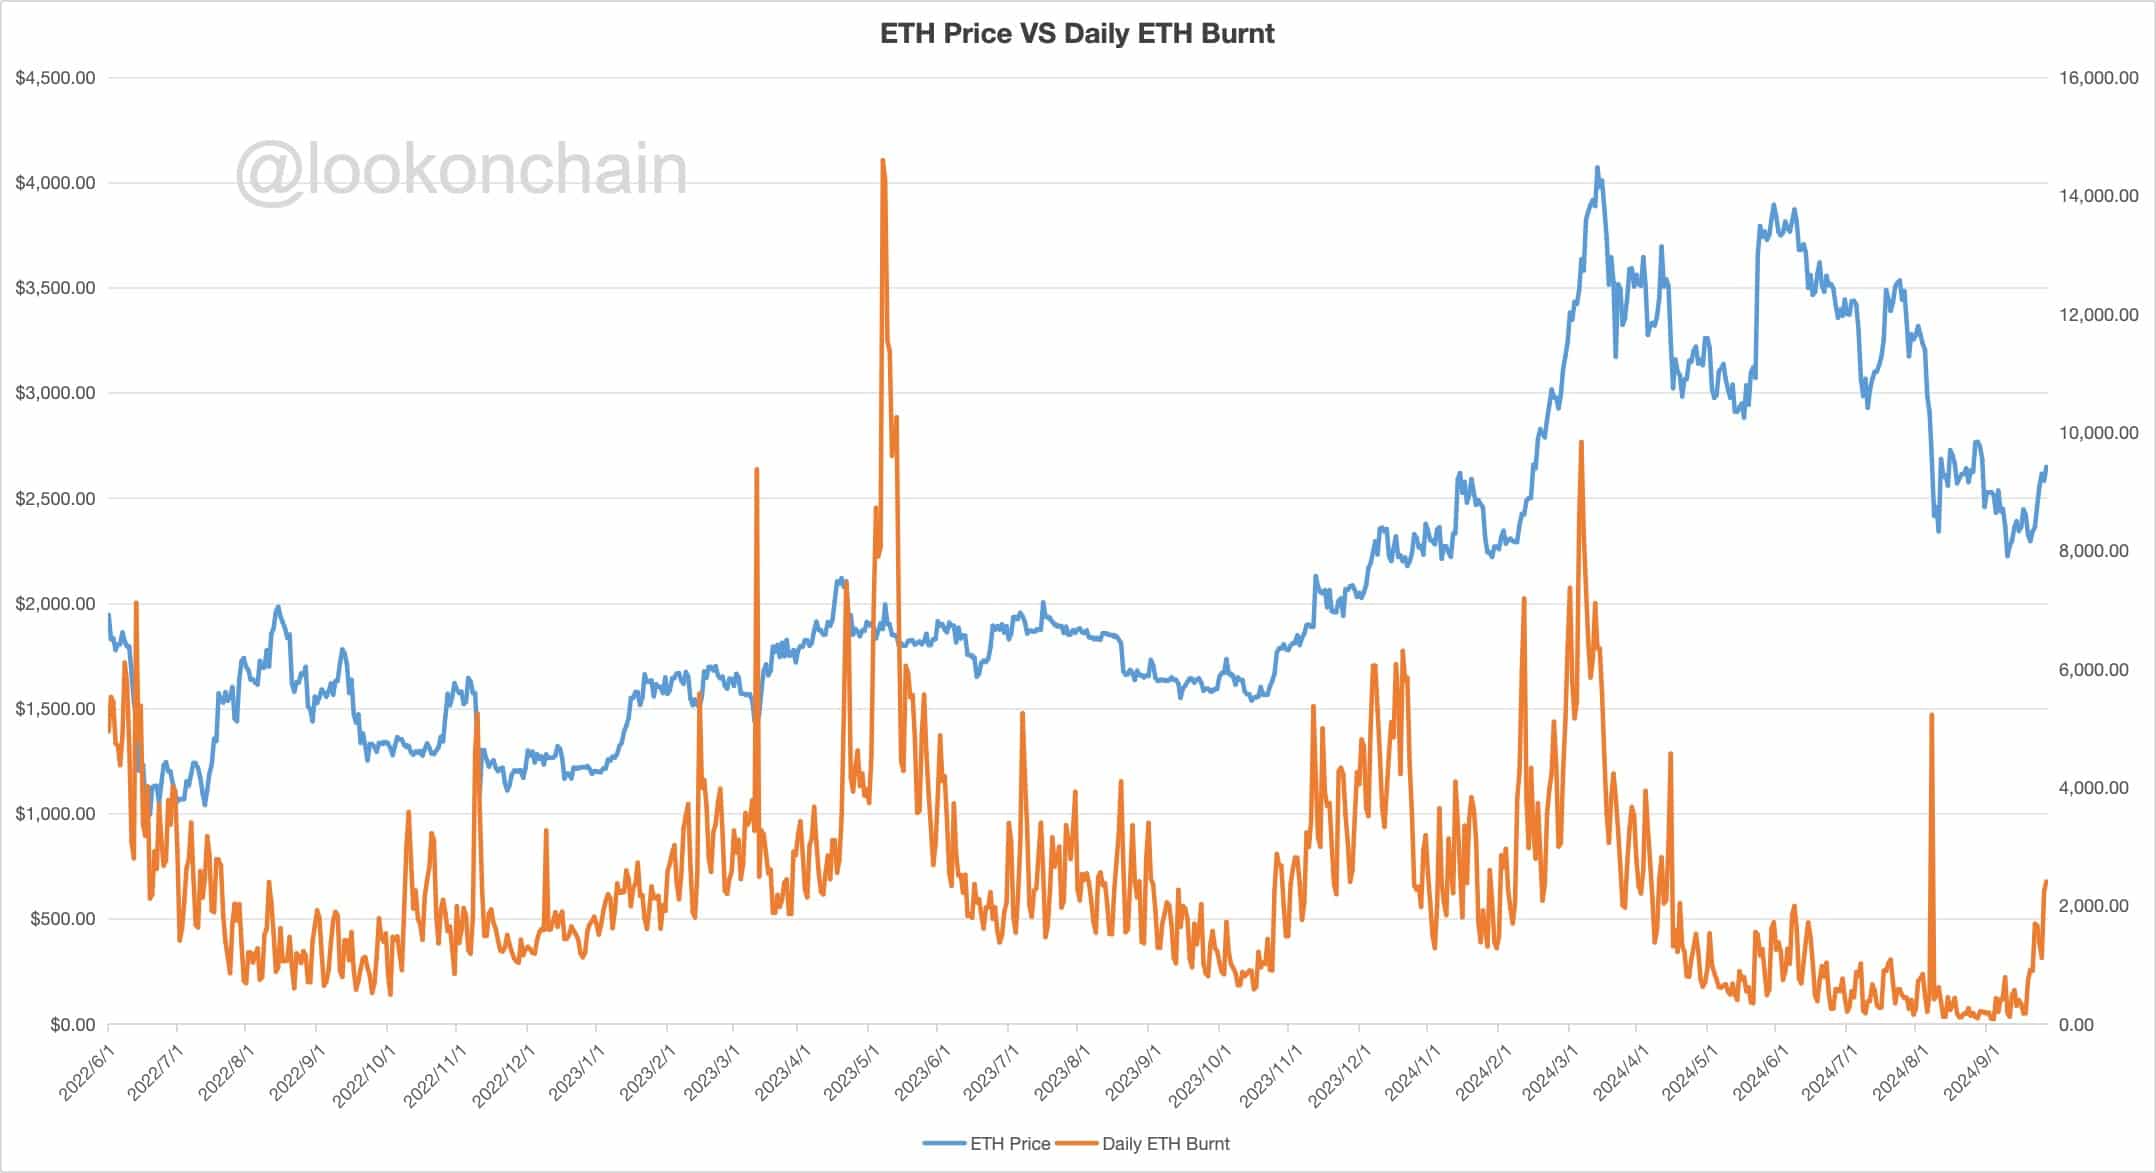
Additionally, the daily amount of ETH being burned has increased by 163% in the past week, providing another positive signal for Ethereum’s future price.
The ETH price and daily ETH burnt chart show a clear pattern, with the amount of ETH burnt increasing before price rises in January and October 2023.
This burning of ETH reduces the overall supply, which can drive the price higher if demand remains steady. As the burn rate rises, so too does the likelihood of ETH’s price increasing.
Read Ethereum’s [ETH] Price Prediction 2024–2025


Source: Lookonchain
Despite the current challenges in market dominance, the strong performance of ETH on key technical levels, whale activity, and the rising burn rate all suggest Ethereum’s price will continue to rise.
These factors point to a bullish future for ETH, even though its dominance in the market may be in decline.

