
- Ethereum’s on-chain metric flashed a bullish sign on the charts
- However, key technical indicators suggested that the coin’s price may fall further.
Ethereum’s [ETH] Age Consumed metric climbed to a one-month high on 18 April. This rally was followed by a slight uptick in the altcoin’s value too, suggesting that a local bottom might have been hit, according to Santiment’s data.
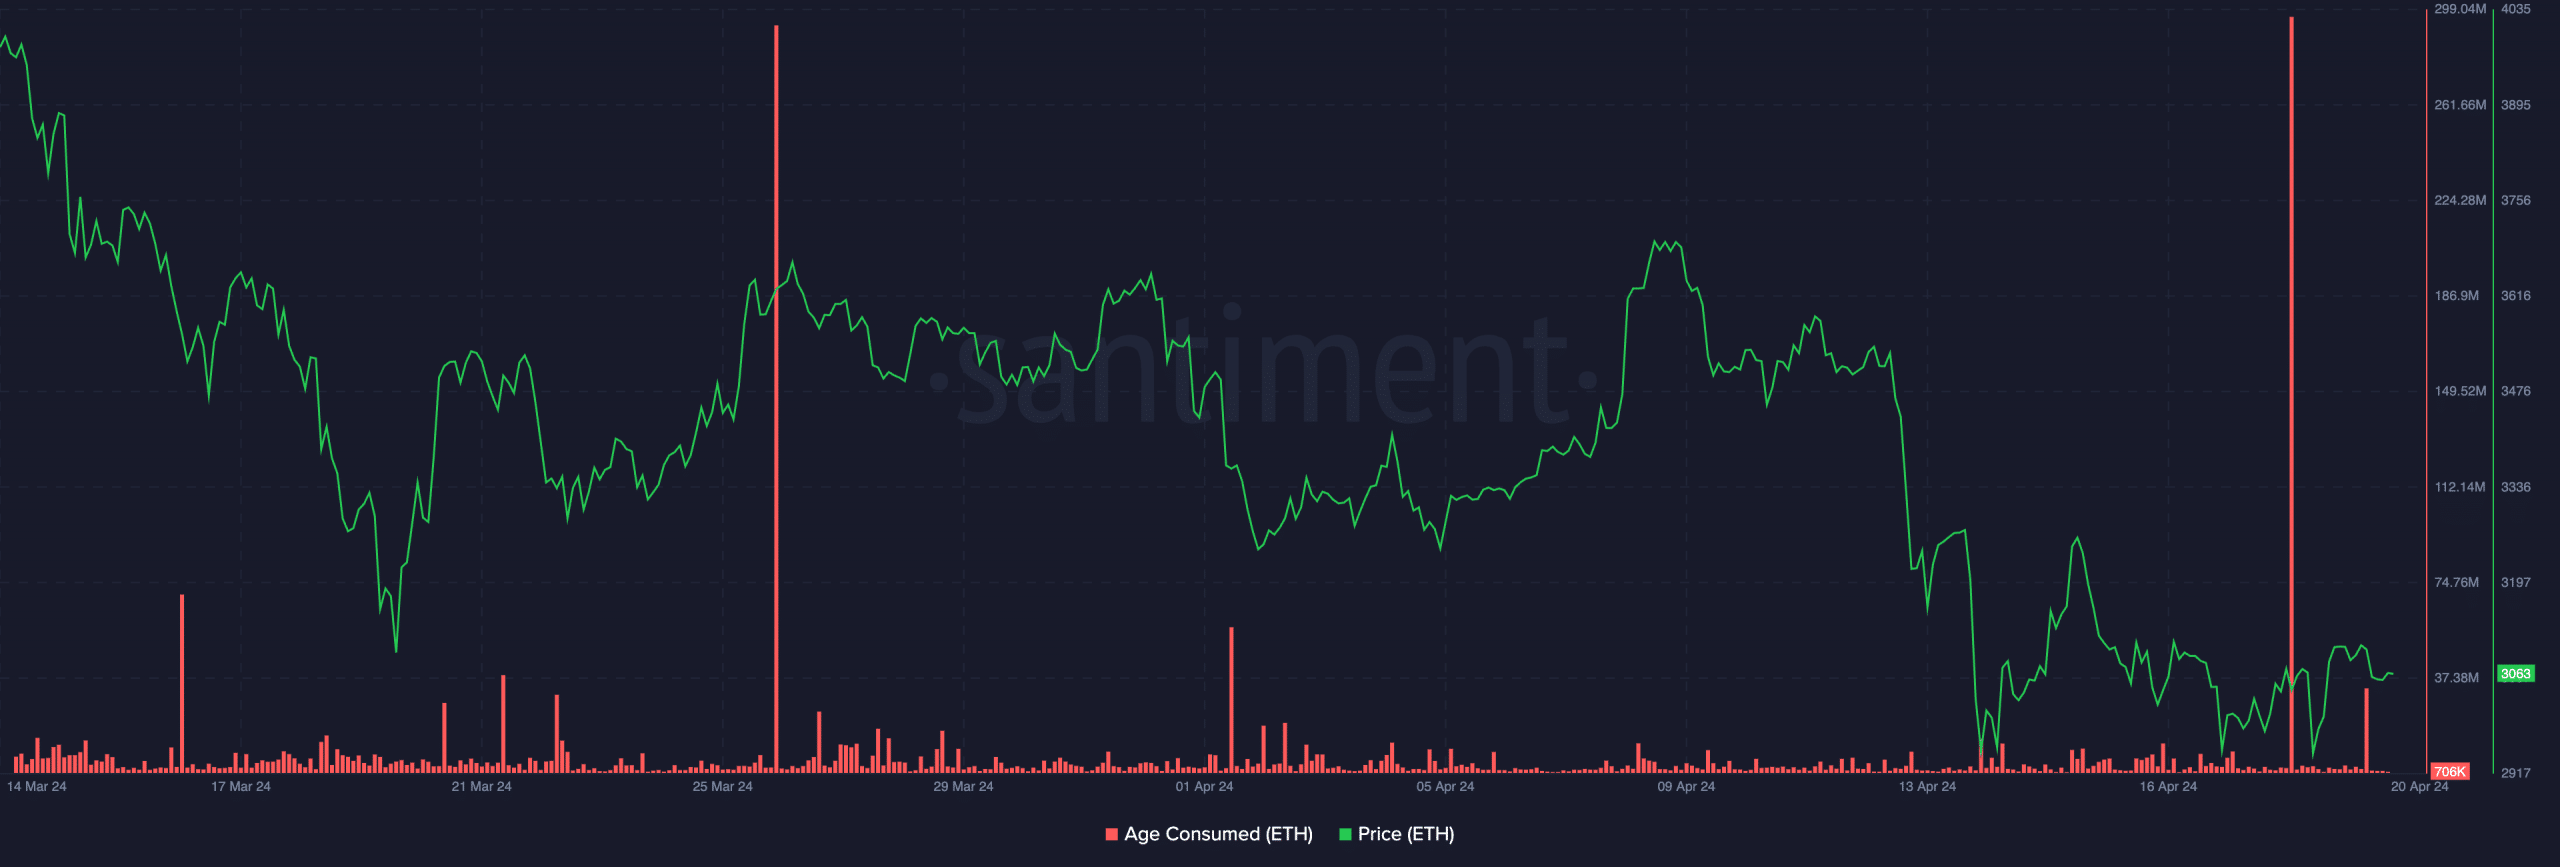
Source: Santiment
Is the bottom in or not?
To assess whether a price bottom is in, it is important to assess ETH’s Age Consumed metric. This metric tracks the movement of its long-held idle coins. It is regarded as a good marker for local tops and bottoms because long-term holders rarely move their dormant coins around. Therefore, whenever this happens, it often results in major shifts in market trends.
Whenever this metric spikes, it indicates that a significant number of previously held idle tokens have begun to change hands. It hints at a strong shift in the behavior of long-term holders.
On the other hand, when an asset’s Age Consumed dips, it means that long-held coins remain in wallet addresses without being traded.
In fact, according to Santiment, Ethereum’s Age Consumed rose to a high of 1.6 million on 18 April. Although ETH’s price briefly fell below $3,000 after this, it quickly rebounded to exchange hands at $3,059 at press time.
Since 18 April, the crypto’s value has risen by 3%, according to CoinMarketCap.
Why caution is necessary
While ETH’s Age Consumed hinted at the possibility of an uptrend, an assessment of the coin’s price movements on the 1-day chart revealed that the short-term outlook remains significantly bearish.
Underlining that bearish power exceeded bullish activity in ETH’s market, its positive directional index (green) rested under its negative index (red).
Is your portfolio green? Check the Ethereum Profit Calculator
When these lines of an asset’s Directional Movement Index (DMI) are positioned this way, it is a sign that the market trend is bearish and the price is under significant pressure from the sellers.
Additionally, readings from the ETH market’s moving average convergence/divergence (MACD) indicator confirmed the prevailing bearish trend, with the MACD line below its signal and zero lines.
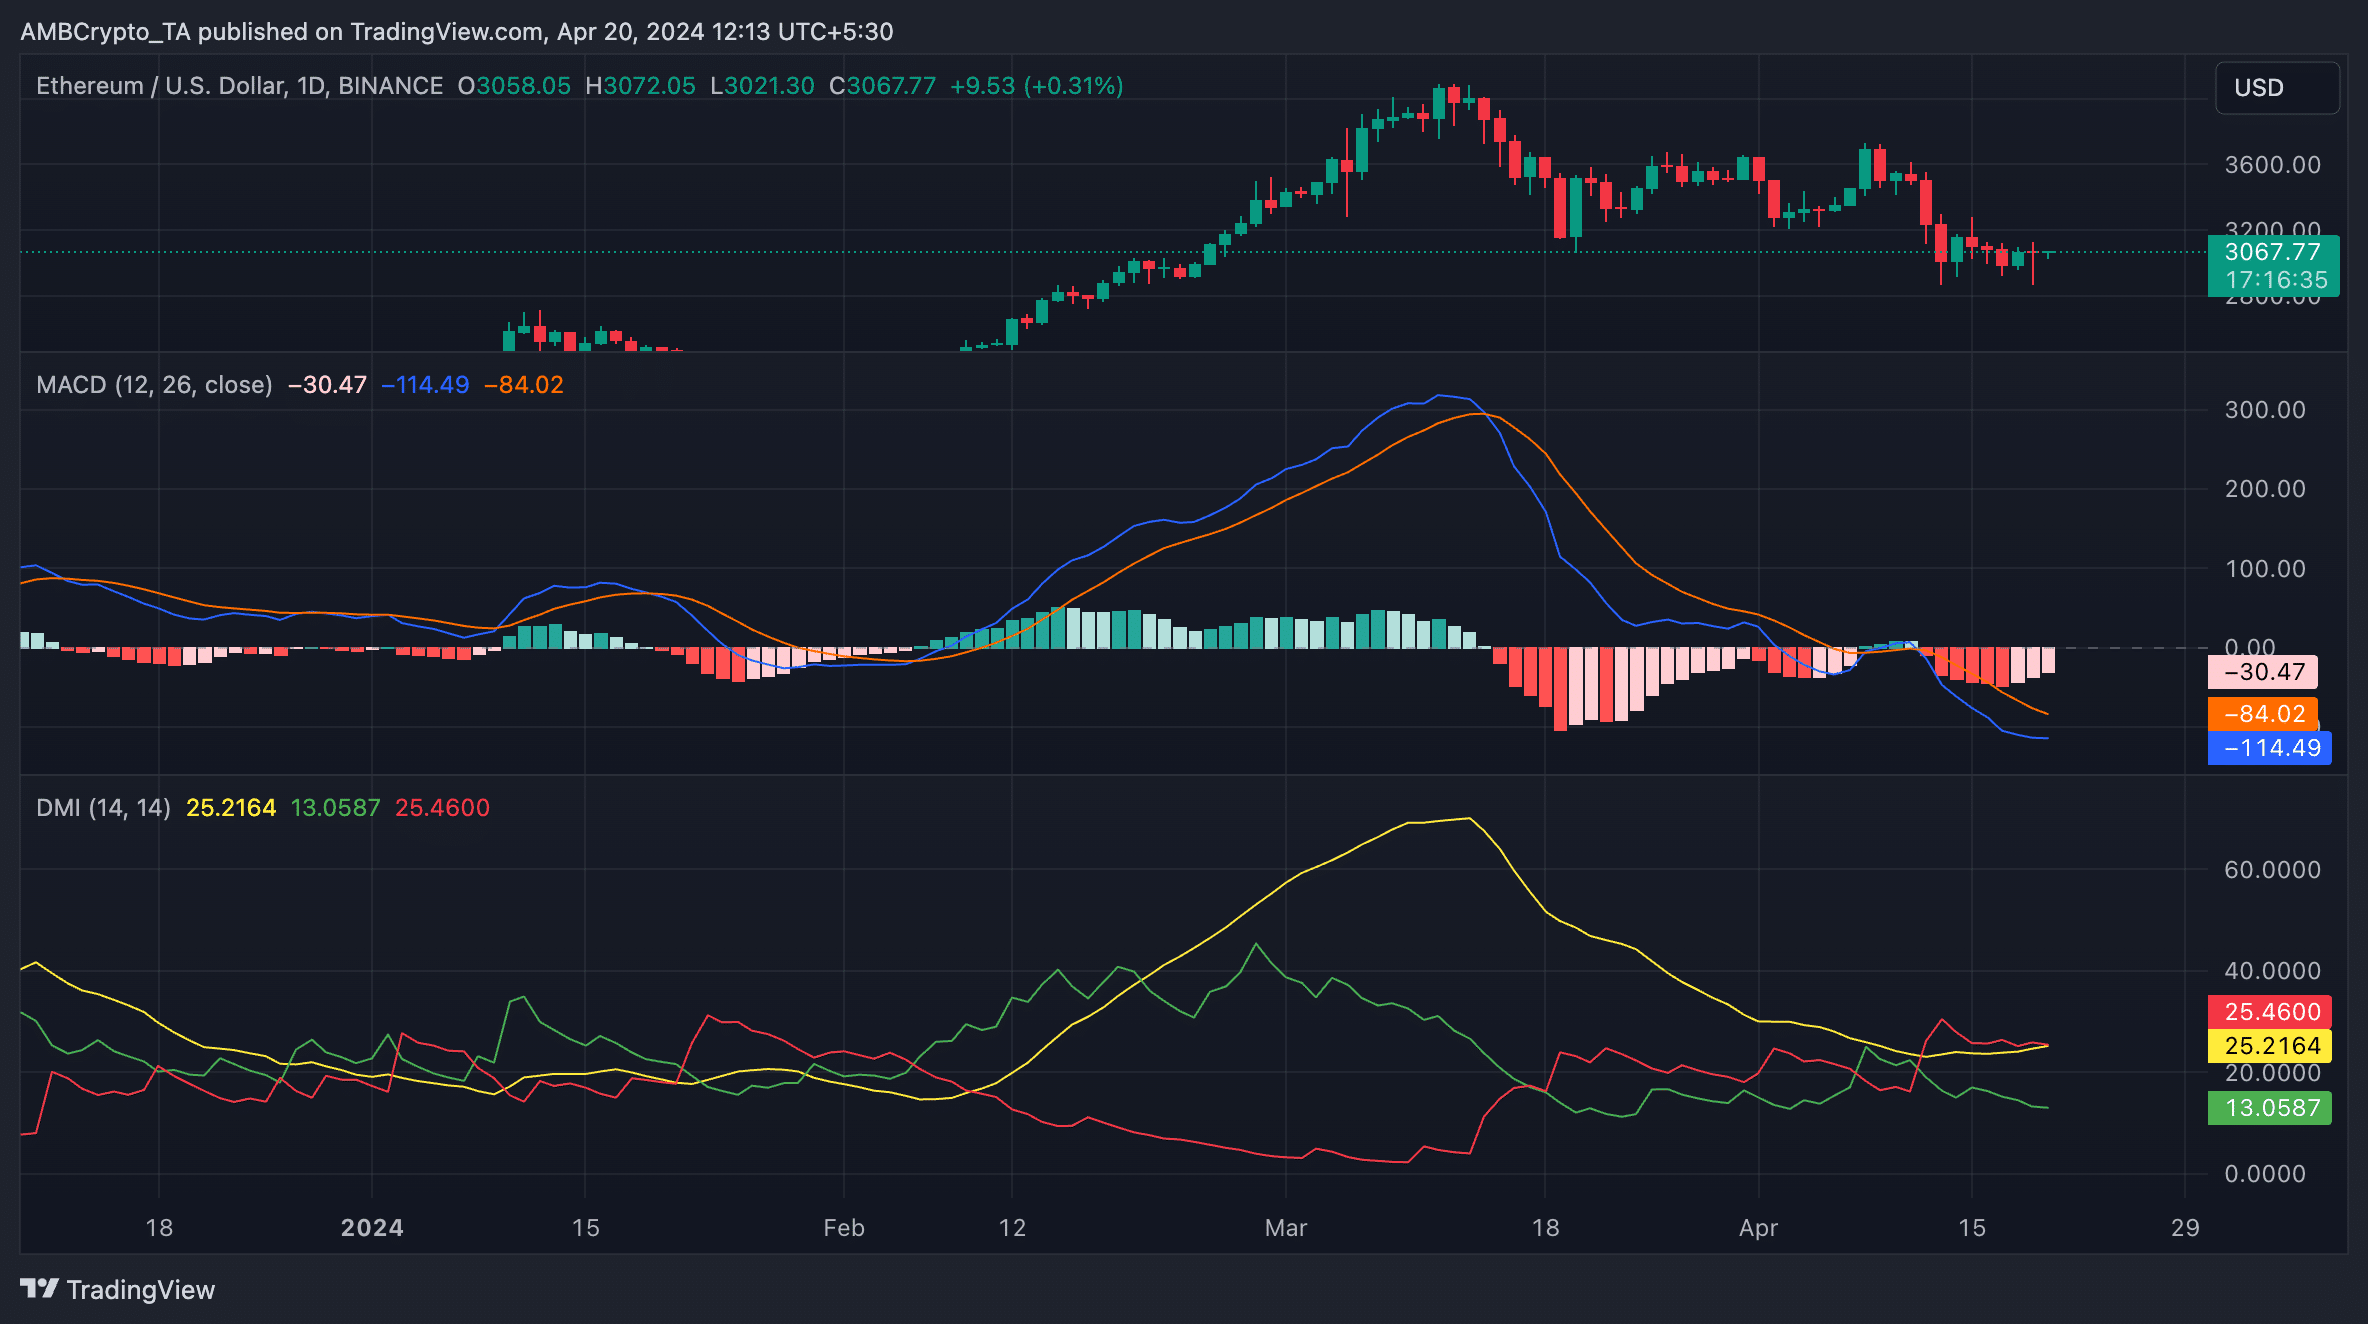
Source: ETH/USDT on TradingView
When these lines are positioned this way, it indicates a strong bearish trend in the market and confirms the possibility of a further decline in an asset’s price.
Market participants often see it as a signal to exit long positions and take short ones. Simply put, it might be a tricky time to navigate Ethereum’s market right now.