- Cardano’s breakout above $1.065 highlighted bullish momentum, targeting $1.77 with growing trader interest
- Strong development activity and rising daily active addresses could bolster its long-term growth potential
Cardano [ADA] recently confirmed a breakout after retesting its key resistance levels, sparking optimism among traders. Trading at $1.07 at press time, following a slight 0.05% hike, the cryptocurrency has seen some renewed strength on the charts lately.
This development has set the stage for ADA to potentially hit its next price target of $1.77. However, with technical indicators and market sentiment painting a mixed picture, can Cardano maintain its upward momentum and lead the crypto market to a broader rally?
How is price action signaling a bullish trend?
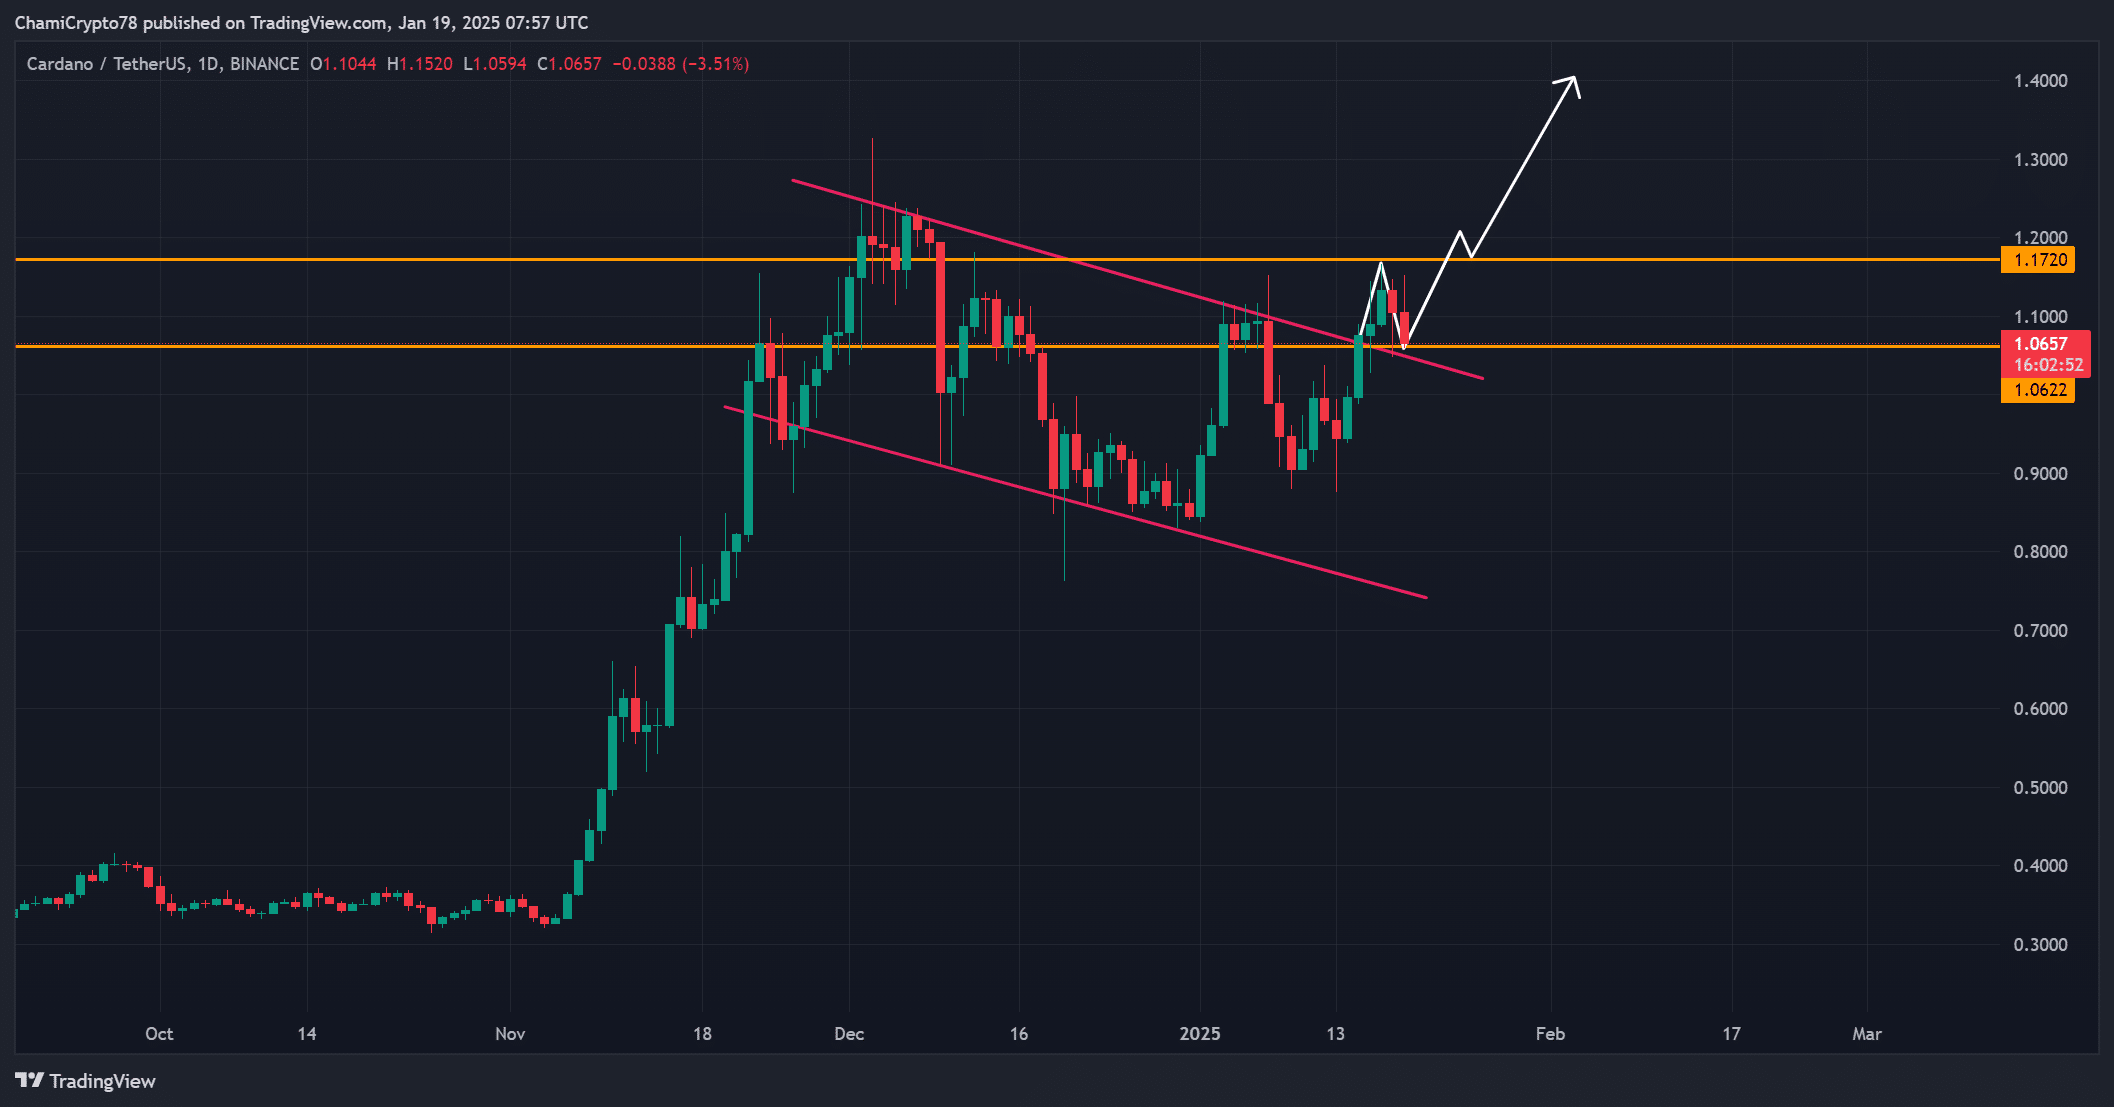
ADA’s price action demonstrated a clear breakout from its descending wedge pattern – A bullish signal for traders. In fact, at the time of writing, the cryptocurrency was holding above the $1.065 support level, with $1.172 acting as the next critical resistance.
Additionally, a sustained push above $1.172 could pave the way for a rally towards $1.77 – A major milestone. However, failure to maintain support at $1.065 might result in a pullback, creating opportunities for buyers to re-enter at lower levels.

Source: TradingView
What does the sharp hike in NVT ratio indicate?
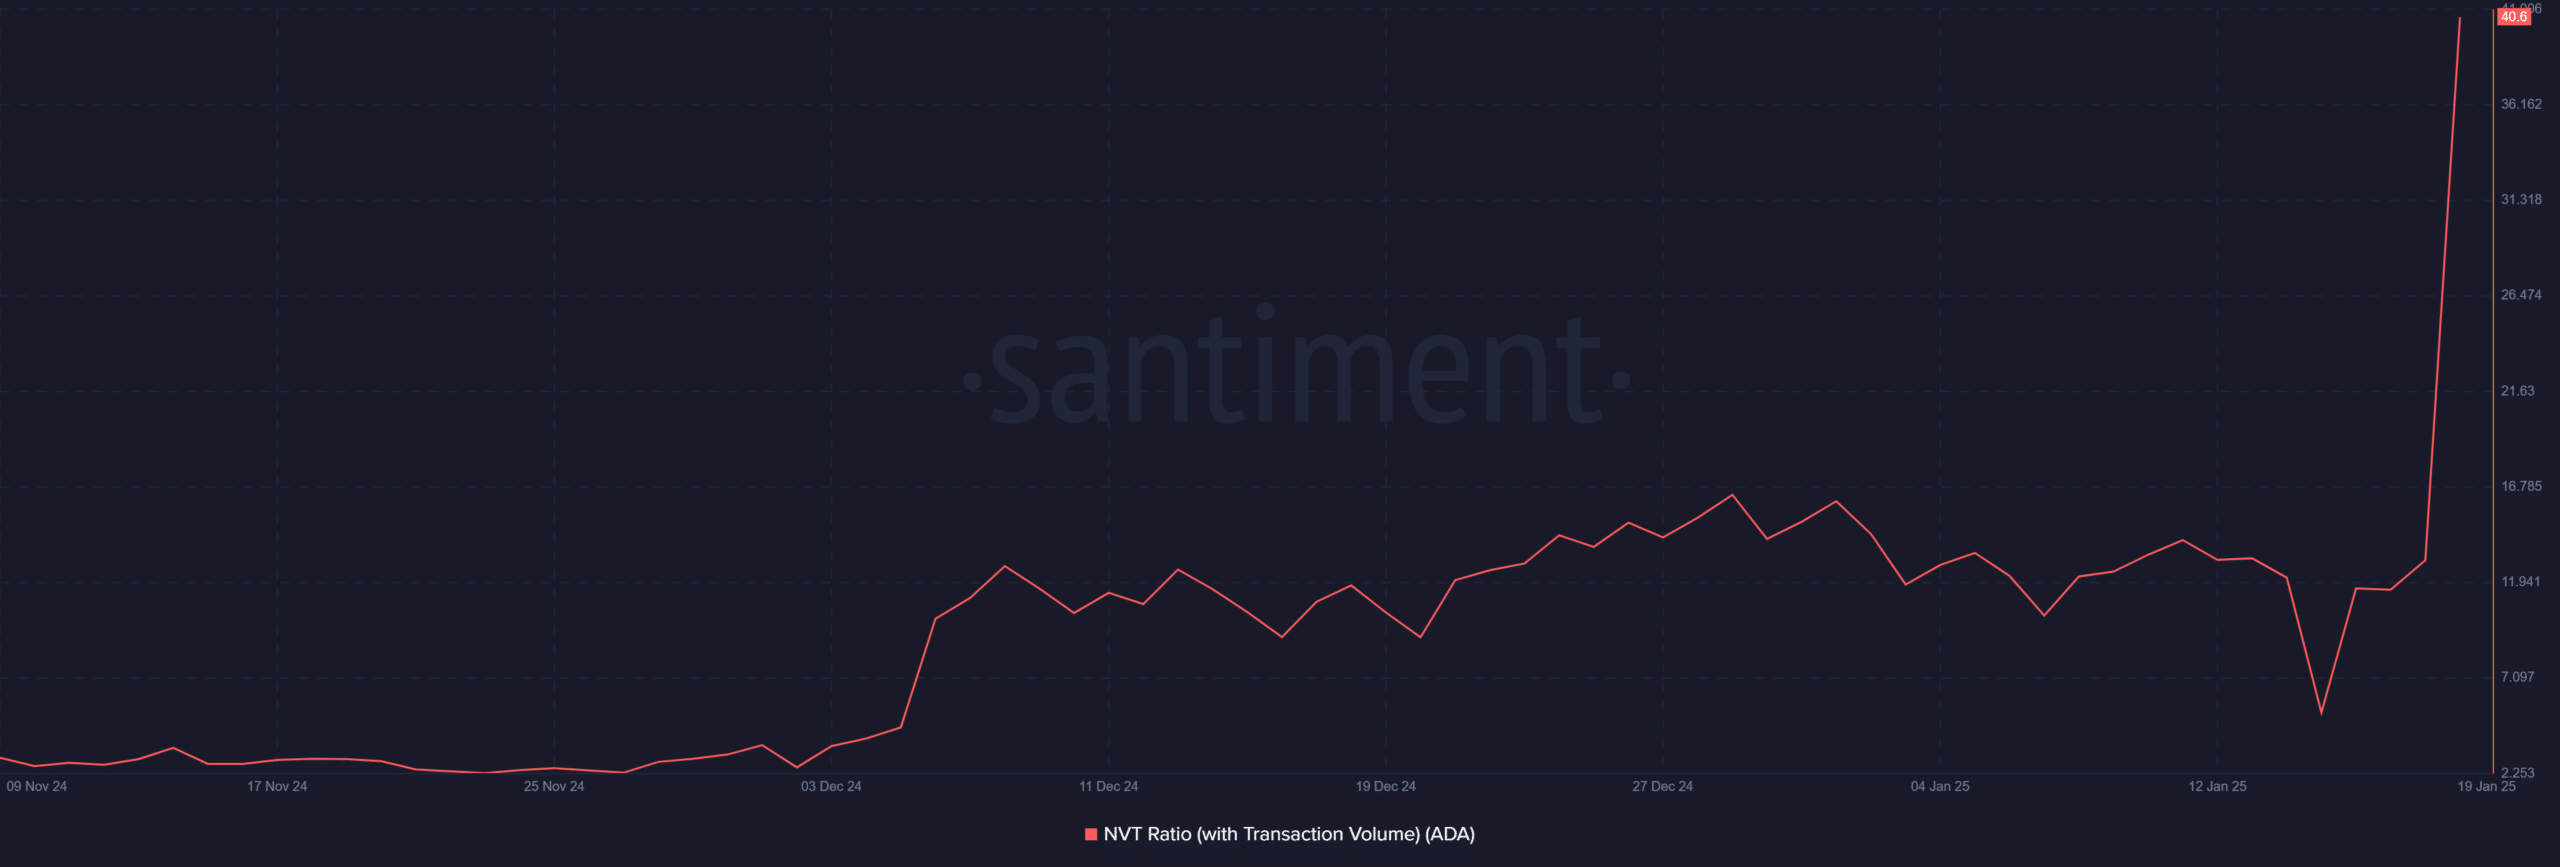
The NVT ratio for ADA surged to 40.6, reflecting an increase in its valuation compared to transaction volume. This metric often signals heightened investor interest, which can drive the price higher in the short term.
However, such a rapid hike can also hint at overvaluation, requiring caution from traders. Therefore, keeping an eye on transaction activity will be critical for understanding the sustainability of this rally.


Source: Santiment
How do daily active addresses reflect network engagement?
The number of daily active addresses on Cardano’s network rose to 40,591 too – Highlighting growing user engagement. Simply put, there has been an uptick in activity within the ecosystem, with the same further validating its fundamental strength.
Additionally, sustained growth in active addresses often supports price stability and bolsters long-term investor confidence. However, maintaining this trend will be essential to ensure ADA continues to attract new participants.


Source: Santiment
Do ADA’s technical indicators support the rally?
The Stochastic RSI at 86.29 indicated that ADA is in the overbought zone, hinting at strong bullish momentum. However, it also warned of a potential pullback if buying pressure eases.
Meanwhile, the ATR at 0.0920 underlined moderate volatility, suggesting traders should prepare for price fluctuations. Therefore, navigating these dynamics carefully will be crucial for market participants aiming to capitalize on this rally.


Source: TradingView
How does ADA development activity fuel growth?
Finally, Cardano’s development activity has rebounded to 38.71, recovering from its December low of under 20. This recovery showcases the blockchain’s commitment to innovation and ecosystem expansion.
Additionally, with growing community-driven projects and regular upgrades, the network continues to attract developers. Such progress reinforces ADA’s long-term growth narrative, aligning its ecosystem improvements with rising market sentiments.


Source: Santiment
Read Cardano’s [ADA] Price Prediction 2023-24
Conclusion
Cardano’s breakout has been supported by strong fundamentals, rising network activity, and significant development progress.
However, traders must remain vigilant as overbought conditions could trigger short-term corrections. With its robust momentum, ADA is well-positioned to sustain its rally and potentially reach new highs, including the $1.77 target.

