
- BONK is the leading meme coin with the most gains in the last week.
- Bullish sentiment has begun to rise in the meme coin’s market.
The value of Solana [SOL]-based meme coin Bonk [BONK] has climbed by over 60% in the last week.
This has caused it to rank as the leading meme asset with the most gains during that period, according to CoinMarketCap data.
The period under review has been marked by a surge in BONK’s daily trading volume. According to Santiment’s data, the indicator rose to a one-month high of $697.3 million on the 24th of April.
This was an 87% jump from the $372 million recorded in trading volume on the previous day.
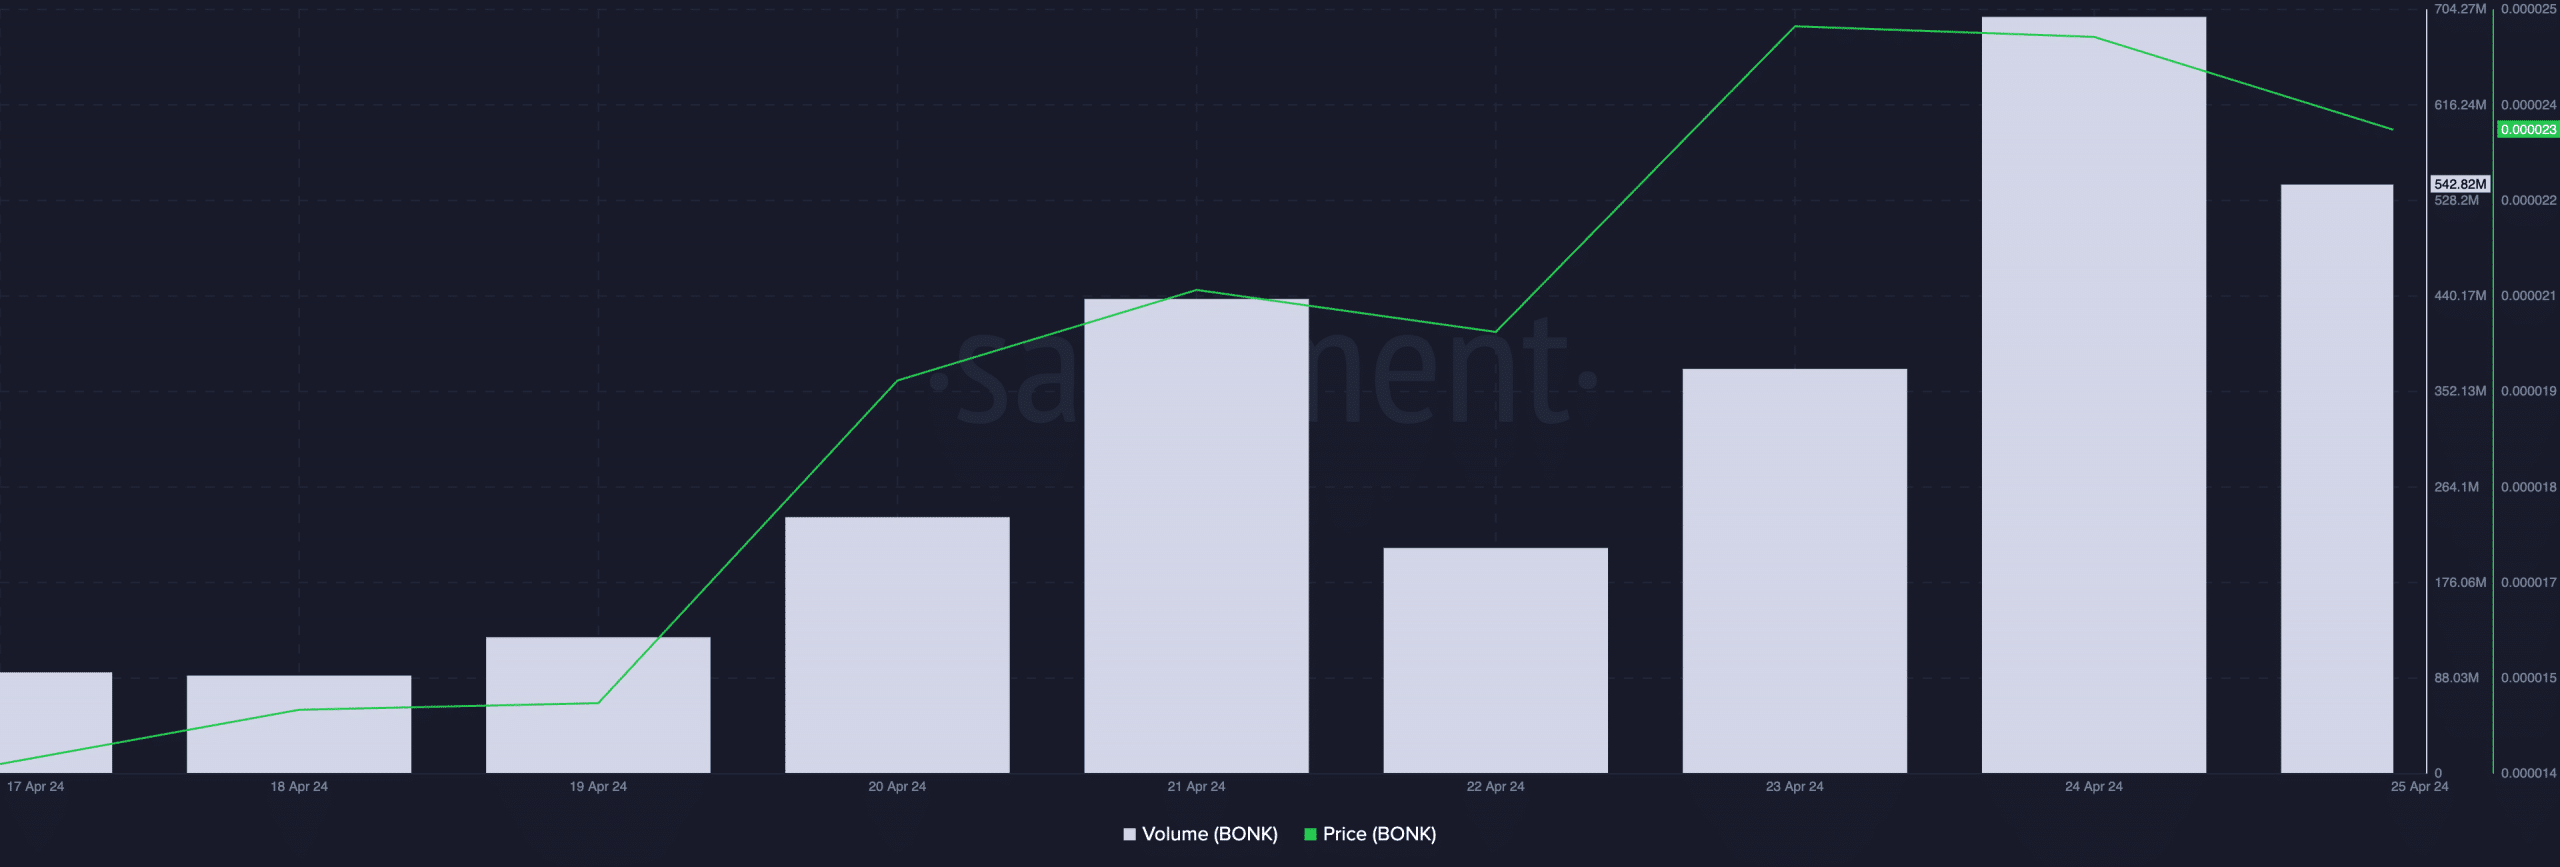
Source: Santiment
Bulls force the bears out
Last week witnessed a significant shift in market sentiment from bearish to bullish. The first indication of that observed on-chain was the flip in BONK’s Weighted Sentiment.
Data retrieved from Santiment showed that the value of this metric changed from negative to positive on the 23rd of April, signaling a decline in bearish sentiments.
On the meme coin’s price chart, readings from key indicators confirmed the re-emergence of BONK bulls. For example, on the 21st of April, the coin’s MACD line (blue) crossed above its signal line.
This upward intersection is often regarded as a bullish signal. It suggests that an asset’s market momentum is shifting in a positive direction and is poised to record a price rally.
Market participants interpret this crossover as a potential buying opportunity or a signal to enter a long position.
However, while readings from BONK’s MACD showed that a bullish crossover had occurred, it remained below the zero line at press time.
This showed that bearish elements persisted in the market, but were not strong enough to drive a decline.
Will BONK continue rising?
Confirming the resurgence in bullish sentiments, the dots that make up BONK’s Parabolic SAR indicator rested below its price at the time of writing.
The Parabolic SAR indicator is used to identify potential trend direction and reversals. When its dotted lines are placed under an asset’s price, the market is said to be in an uptrend.
It indicates that the asset’s price is increasing and may continue to do so.
Realistic or not, here’s BONK’s market cap in BTC’s terms
Regarding the demand for the altcoin, its key momentum indicators rested above their respective center lines as of this writing. Its Relative Strength Index was 56.04, while its Money Flow Index (MFI) was 68.64.
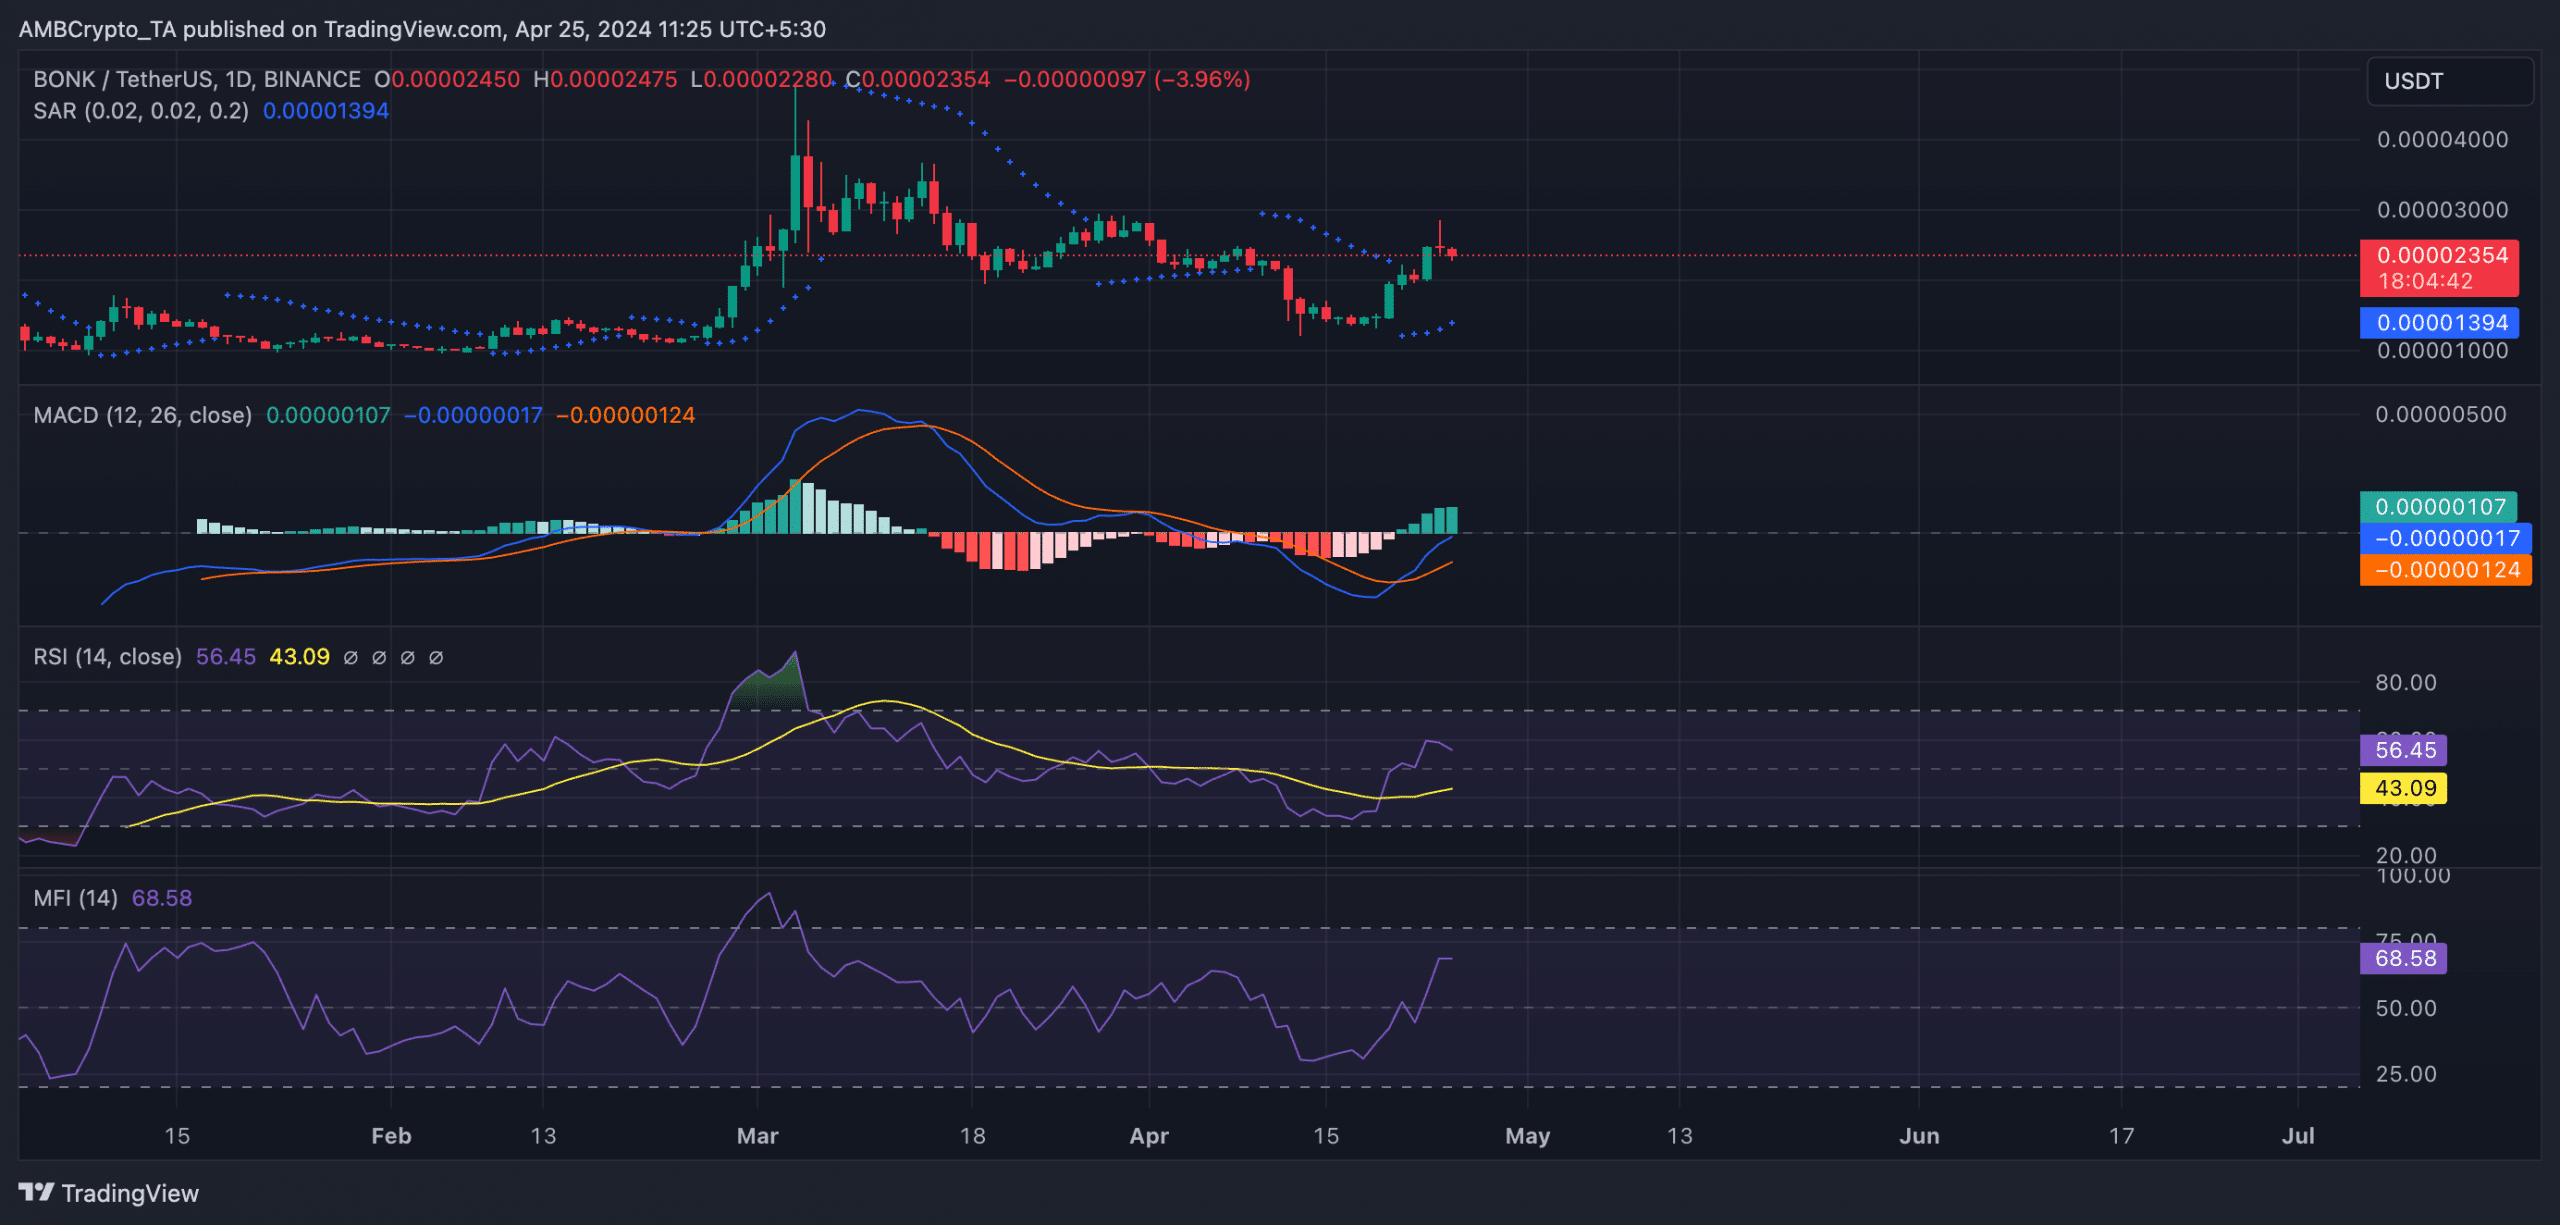
Source: BONK/USDT on TradingView
These values showed that market participants favored BONK accumulation over sell-offs.