- Analysts predicted a 46% surge for Arbitrum if it breaks the $0.78 resistance within the descending triangle.
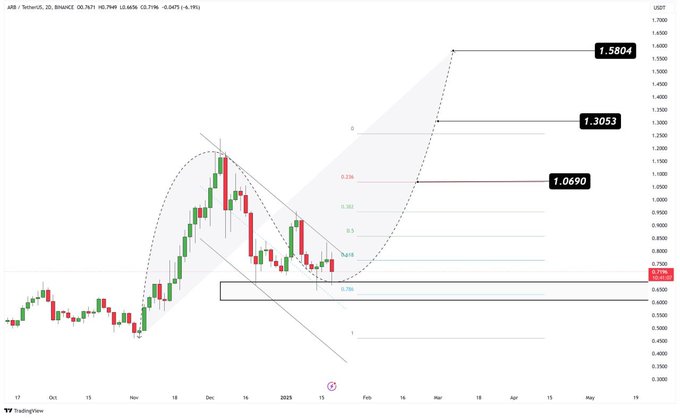
- On-chain data showed bearish sentiment, but traders target $1.0690 if bullish momentum returns.
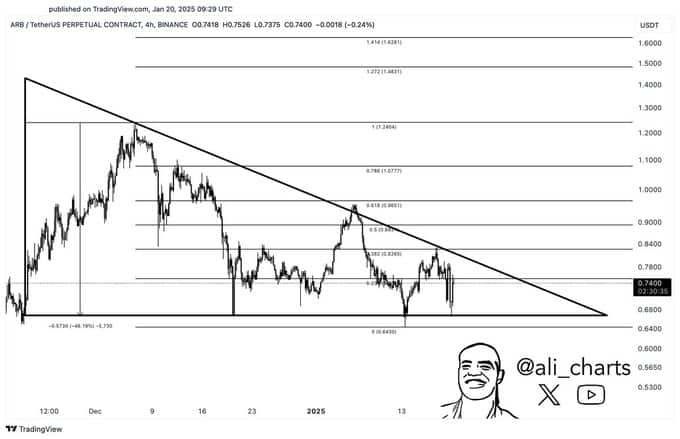
Arbitrum [ARB] was trading within a classic descending triangle pattern, a structure often associated with potential breakout opportunities.
Analysts suggest a breakout could lead to a 46% price rally, placing the spotlight on ARB’s next move. With the price currently consolidating near key support levels, traders are watching for critical price reactions.
At the time of writing, ARB was trading at $0.7066, with a 24-hour trading volume of $606,785,204, reflecting a 3.51% decline in the past day.
ARB has also experienced a 7-day decline of 3.24%, and its market cap is currently valued at $3.05 billion, with a circulating supply of 4.3 billion ARB tokens.
Key support and resistance levels
The ARB/USDT chart indicates bearish pressure, with the price consolidating near the $0.6890 support level, which is critical for stability.
Failure to hold above this level could drive prices lower, potentially testing $0.6500, a psychological support level.
Immediate resistance is noted at $0.78, where the descending trendline has rejected price movements multiple times.
Fibonacci retracement levels at $0.8661 (0.618) and $0.9077 (0.786) represent key hurdles if ARB attempts an upward move.
Source: X
According to analysts, a decisive breakout above these levels could pave the way for an upward trajectory toward $1.0690 or higher.
Indicators signal bearish sentiment
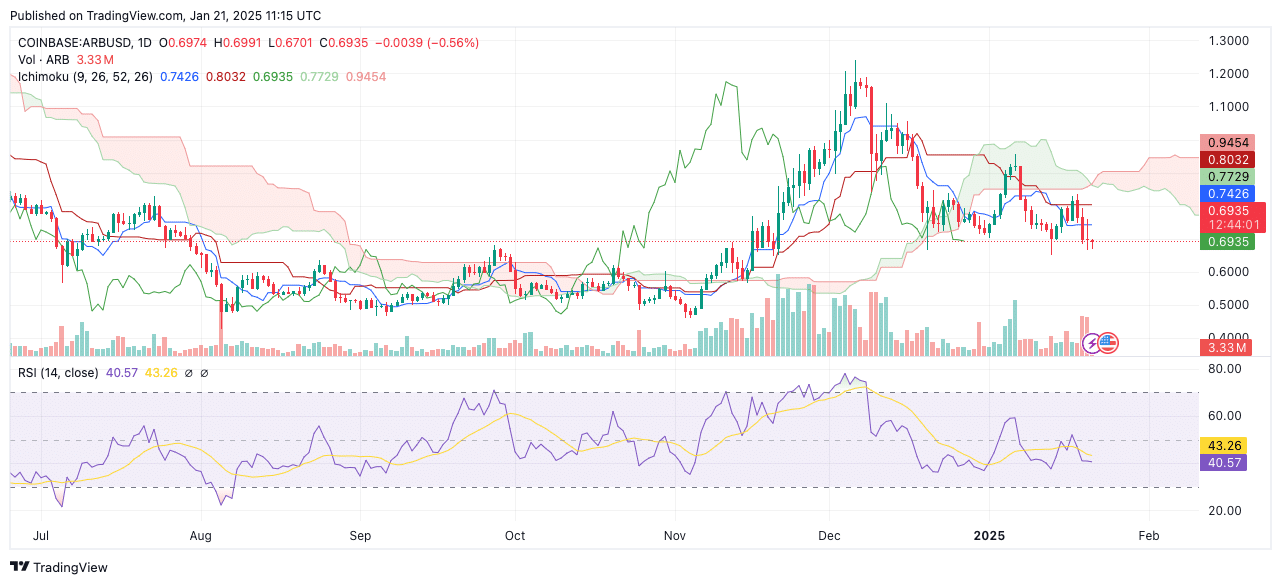
Technical indicators align with a bearish outlook in the short term. ARB’s Ichimoku Cloud analysis shows the price trading below the cloud, suggesting prevailing bearish momentum.
Additionally, the Tenkan-sen ($0.7426) and Kijun-sen ($0.8032) lines are acting as significant resistances.
The Relative Strength Index (RSI) stands at 40.57, just above oversold territory, indicating weak momentum. Despite this, there are no signs of bullish divergence, suggesting sellers continue to dominate.

Source: TradingView
Weak volume activity further reinforces the lack of buying interest, making the next move highly dependent on whether ARB can reclaim the $0.74 level.
On-chain metrics reflect declining participation
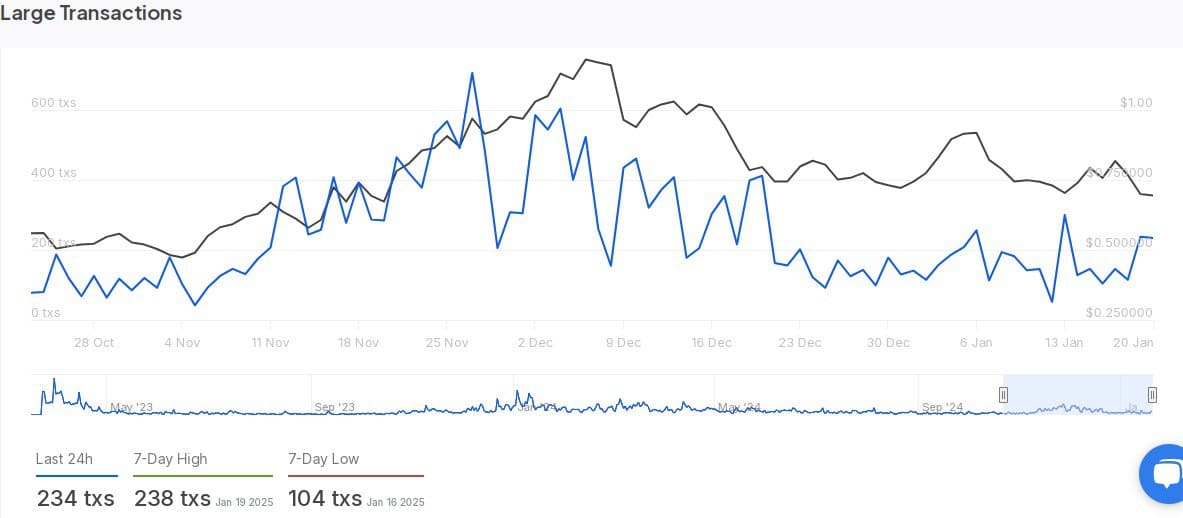
On-chain data from IntoTheBlock indicates a bearish sentiment, with all four metrics trending negatively.
Net Network Growth at -1.10% shows reduced new participant activity. The “In the Money” metric stood at -2.09% highlighting a decrease in profitable wallet addresses.
Large transaction activity remains subdued, with 234 transactions in the past 24 hours, down from a 7-day high of 238.
Analysts attribute the decline to a lack of interest from high-value investors, correlating with the price stagnating near the $0.50 region.

Source: IntoTheBlock
Traders eye a potential rally
Despite the bearish signals, analysts remain optimistic about a potential breakout from the descending triangle.
Rose Premium Signals projects upside targets at $1.0690, $1.3053, and $1.5804, provided ARB can break above the trendline.

Source: X
Read Arbitrum’s [ARB] Price Prediction 2024–2025
As ARB consolidates near support, the next move could define its medium-term trajectory, with traders closely monitoring for a potential breakout.

